3941
0
25.03.2020 Forex Morning Analysis
25.03.2020 Forex Morning AnalysisnEUR / USD may rise 30 to 75 pips.Pivot Level1,0750 our preferenceTarget 1.0845 at 1.0750 and buy positions at advancing levels 1,0890.
Yazar: Zack Smith
Yayınlanma: 26 Mart 2020 17:14
Güncellenme: 21 Haziran 2026 14:27
25.03.2020 Forex Morning Analysis
EUR / USD may rise 30 to 75 pips.
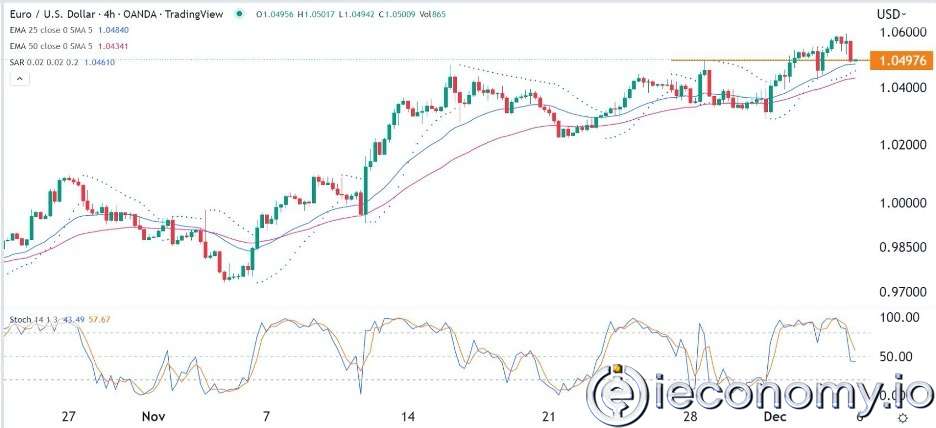
Pivot Level 1,0750 our preference Target 1.0845 at 1.0750 and buy positions at advancing levels 1,0890.Alternative scenario Below the 1.0750 level, the target may decline to 1,0720 and 1,0690.Technical Commentary The RSI indicator is in a good direction. Supports and resistors 1,09351,08901,08451,0815 Last1,07501,07201,0690 The number of asterisks indicates the strength of the support and resistance levels.EUR / JPY may rise 86 to 125 pips.
Pivot Level 119.50 our preference If 119.50 support continues, 121,31 can be seen. Alternative scenario A downward break of 119.50 brings levels of 118.85 and 118.46. Technical Commentary RSI (relative power index) above 50.MACD (trend deviation indicator) below the signal line, but positive. Moreover, the current price supports and resistances above 20 and 50 moving averages (120.00 and 119.91 respectively) 122,09 **121,70 *121,31 **120,92120,06 son119,76119,50 **118,85 *118,46 **the number of asterisks indicates the strength of support and resistance levels.EUR / GBP may rise by 70 to 103 pips.
Pivot Level 0.9108 our preference Short-term recovery in the direction of 0.9259.Alternative scenario A downward break of 0.9108 brings 0.9053 and 0.9021 levels. Review RSI (relative power index) below 50.The MACD (trend deviation indicator) is above the signal line, but negative. Moreover, the current price supports and resistances below 20 and 50 moving averages (0.9170 and 0.9210 respectively) 0,9324 **0,9291 *0,9259 **0,92260,9156 son0,91290,9108 **0,9053 *0,9021 **the number of asterisks indicates the strength of support and resistance levels.USD / JPY may rise 50 to 80 pips.
Pivot Level 110.75 our preference Buying positions above 110.75, target 111,70 and advancing levels 112,00. Alternative scenario Below the 110.75 level, the target can be reduced to 110.40 and 110.05.Technical Commentary The RSI indicator is complicated in the direction of the bull. Supports and resistors 112,30112,00111,70111,20 Son110,75110,40110, 05 The Asterisk number indicates the strength of support and resistance levels.USD / CAD may drop from 65 to 110 pips.
Pivot Level 1,4455 our preference Sales positions, target 1.4280 below 1.4455 and 1.4235 at advancing levels.Alternative scenario Above the level of 1.4455, the target can be seen rising to 1.4510 and 1.4560.Technical Commentary The RSI indicator is in bad shape. Supports and resistors 1,45601,45101,44551,4345 Son1,42801,42351, 4165 asterisks indicate strength of support and resistance levels.USD / TRY may fall 220-460 pips.
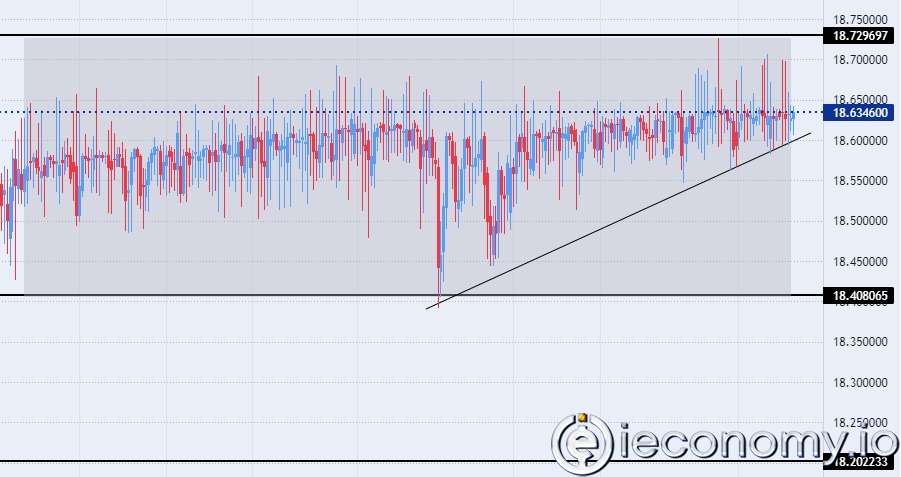
Pivot Level 6,4640 our preference Sales positions below 6,4640 with the target at 6,4130 and advancing levels at 6,3890.Alternative scenario Above the level of 6,4640, the target can be seen rising to 6,5020 and 6,5450.Technical Commentary Unless the resistance at 6,4640 is exceeded, there is a high risk of downward fracture at 6,4130.Supports and resistors The asterisk number 6,54506,50206,46406,4350 Son6,41306,38906,3410 indicates the strength of support and resistance levels.GBP / USD may rise 41 to 81 pips.
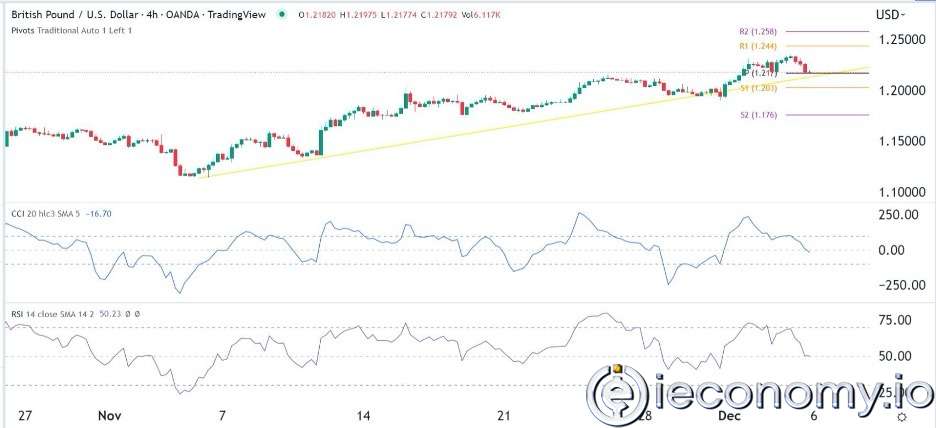
Pivot Level 1,1750 our preference Buying positions above 1.1750, target 1.1890 and advancing levels 1.1930.Alternative scenario Below the level of 1.1750, the target may decline to 1.1700 and 1.1650.Technical Commentary The RSI indicator is in a good direction. Supports and resistors The number of asterisks 1,20001,19301,18901,1849 Son1,17501,17001,1650 indicate the strength of support and resistance levels.GBP / JPY may rise to 120-177 pips
Pivot Level 130.31 our preference 132.90 can be seen if 130.31 support continues.Alternative scenario A downward break of 130.31 brings levels of 129.35 and 128.77. Technical Commentary RSI (relative power index) above 50.MACD (trend deviation indicator) below the signal line, but positive. Moreover, current price supports and resistances above 20 and 50 moving averages (130.89 and 130.19 respectively) 134,05 **133,48 *132,90 **132,33131,13 son130,69130,31 **129,35 *128,77 **the number of asterisks indicates the strength of support and resistance levels.Gold spot-1558.00-1585.00 may fall in the price range.
Pivot Level 1628,00 our preference Sales positions below 1628.00 to target 1585.00 and 1558.00 at advancing levels.Alternative scenario Above the level of 1628.00, the target can be seen rising to 1643.00 and 1668.00.Technical Commentary The RSI indicator supports further decline.Supports and resistors 1668,001643,001628,001602,00 Son1585,001558,001517, 00 asterisk number indicates strength of support and resistance levels.Crude Oil (WTI) – may rise to a price range of 26.25-27.20.
Pivot Level 23.50 our preference Buying positions with a target of 26.25 at 23.50 and 27.20 at advancing levels.Alternative scenario Below the level of 23.50, the target may drop to 22.60 and 21.75.Technical Commentary The RSI indicator is complicated in the direction of the bull.Supports and resistors 28,2527,2026,2524,88 Son23,5022,6021, 75 asterisks indicate strength of support and resistance levels.The Nikkei 225 could rise to the 19970 – 20700 price range.
Pivot Level 18440 Our preference Buying positions above 18440 with the target being 19970 and 20700 at advancing levels.Alternative scenario Below the 18440 level, the target could be reduced to 17600 and 17050.Technical Commentary The RSI indicator supports the continuation of the rise.Supports and resistors 21400207001997019278 Son184401760017050 the Star Sign number indicates the strength of the support and resistance levels.DAX – may rise to the price range of 10000.00-10410.00.
Pivot Level 9200,00 our preference Buying positions above 9200.00 to target 10000.00 and at advancing levels to 10410.00.Alternative scenario Below 9200.00, the target may drop to 8745.00 and 8450.00.Technical Commentary The RSI indicator supports the continuation of the increase.Supports and resistors 10760,00 **10410,00 ***10000,00 **9700,00 Son9200,00 ***8745,00 **8450,00 **the number of asterisks indicates the strength of support and resistance levels.Boeing – 70.60-82.00 could fall in price range.
Pivot Level 144.5 our preference 144.5 if resistance continues, the decline will continue.Alternative scenario Breaking the level of 144.5 upwards brings levels of 165.6 and 178.1. Technical Commentary RSI (relative Power Index) shows oversold (<30).MACD (trend deviation indicator) below the signal line and negative. Moreover, the current price is below 20 and 50 moving averages (199.91 and 276.68 respectively)supports and resistances 178.1 **165.6 *144.5 **136.3127.68 son93.482 **70.6 *59.2 **the number of asterisks indicates the strength of support and resistance levels.Autodesk - 92.90-105.10 may fall in price range.
Pivot Level 170.7 25.03.2020 Forex Signal Morning AnalysisİLGİLİ HABERLER
European stocks soared and focus shifted to German retail sales after Powell's speech!
Forex Signal For TRY/USD: Inflation Slowdown in November.
Forex Signal For GBP/USD: Bullish Trend Still Not Breaking While Recovery Continues.
Forex Signal For EUR/USD: Starry US Data Points to Higher Fed Increases.
Forex Signal For BTC/USD: Downside Continues as Bitcoin Recovery Moves Less.
En Popüler Haberler
Yorum Yap
Yorumlar
Henüz yorum yapan yok! İlk yorumu siz yapın...