2827
0
After The Latest Development EOS Is On The Rise!
EOS is on the rise after the latest development! The popular altcoin has seen levels not seen since June 2018. Here are the details..

Yazar: Eylem Özer
Yayınlanma: 13 Mayıs 2021 16:14
Güncellenme: 5 Şubat 2026 12:47
After The Latest Development EOS Is On The Rise!
EOS is on the rise after the latest development! The popular altcoin has seen levels not seen since June 2018.
Popular altcoin EOS gained 63 percent overall yesterday after BlockOne announced that it raised $ 10 billion to launch a new exchange. After the news, the cryptocurrency ended its rise from $ 9.00 to $ 14 at the end of the day. Yesterday, EOS continued to climb to $ 14.87 not seen since June 2018. While at this level, it faced resistance and dropped to the $ 13.25 level. EOS had begun to rise in early May before the news in question was made. Last week, it started its rise from $ 6.00 to break the long-term resistance trend line and reach the $ 13 level. It dropped as low as $ 9.00 at the beginning of the week until it found support from that level.EOS-USD Short Term Price Prediction
Looking ahead, initial resistance is located at $ 14.85. This is followed by $ 16.50, $ 17.75, $ 19.25 and $ 20. On the other hand, initial support is at $ 13. This is followed by $ 12.30, $ 10.78, $ 10 and $ 9.55. The RSI is showing signs of a bearish trend as the price action sets a new high. This could also be an indication of a near pullback that could pull EOS to $ 10 in the short term.EOS / BTC - Bulls Approach Highlights of October 2020
Key Support Levels: 22,175 SAT, 20,000 SAT, 17,700 SAT. Key Resistance Levels: 26,190 SAT, 27,500 SAT, 29,600 SAT. Popular altcoin EOS also performs very well against BTC. As it started to rise above 22,000 SAT in the first week of May, it started below 12,000 SAT. It started to decline last week until around 16,000 SAT support was available over the weekend. The news of the new exchange brought EOS / BTC to rise as it recovered from 16,000 SAT yesterday to above 25,000 SAT. Yesterday it pushed 26,190 SAT levels before dropping back to the current 22,900 SAT level.EOS-BTC Short Term Price Prediction
Looking ahead, initial support is at the 22.175 SAT level. It is followed by 20,000 SAT, 17,700 SAT and 15,700 SAT. On the other hand, the initial resistance is at 26,190 SAT. It is followed by 27,500 SAT, 29,600 SAT, 31,565 SAT and 33,000 SAT. Similarly, the RSI also shows hints of a bearish trend that could cause a short term pullback in the market.İLGİLİ HABERLER

European stocks soared and focus shifted to German retail sales after Powell's speech!

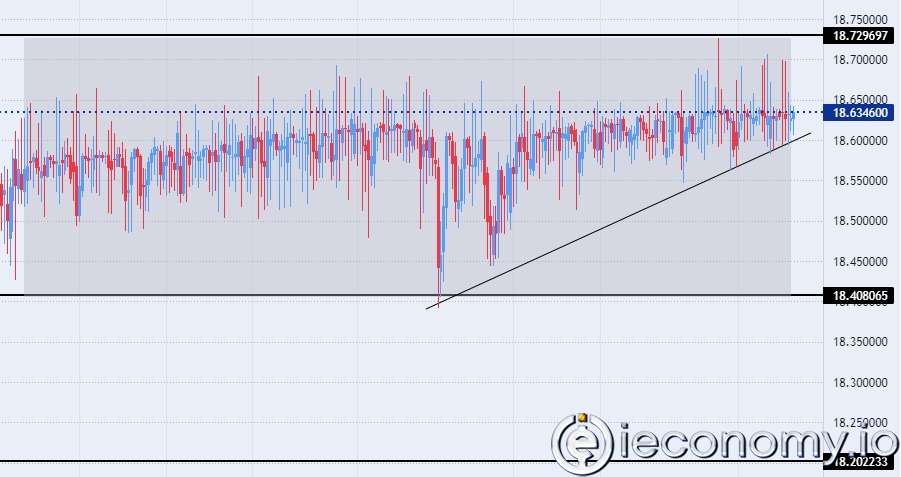
Forex Signal For TRY/USD: Inflation Slowdown in November.

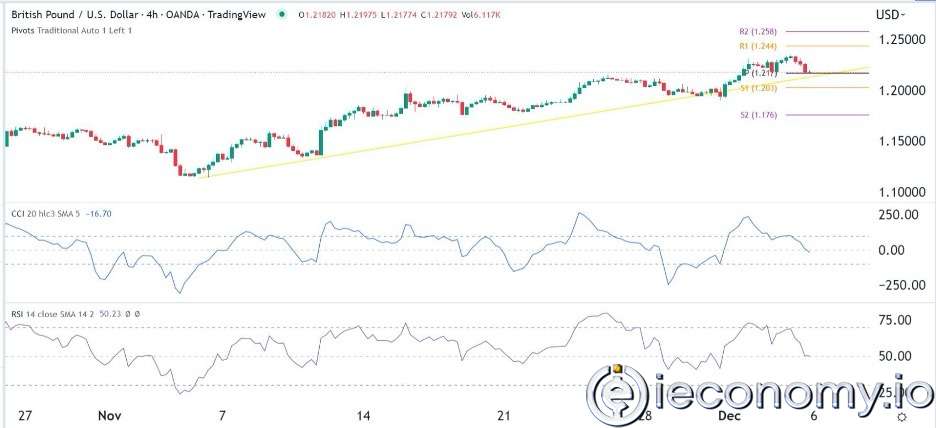
Forex Signal For GBP/USD: Bullish Trend Still Not Breaking While Recovery Continues.

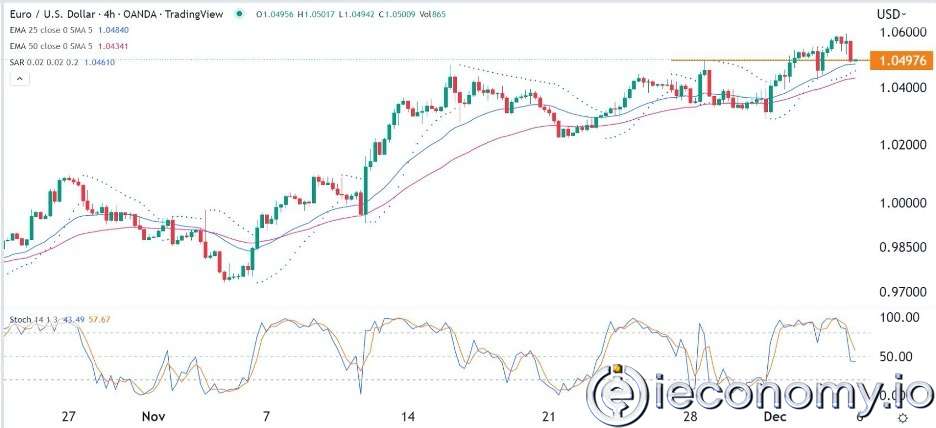
Forex Signal For EUR/USD: Starry US Data Points to Higher Fed Increases.

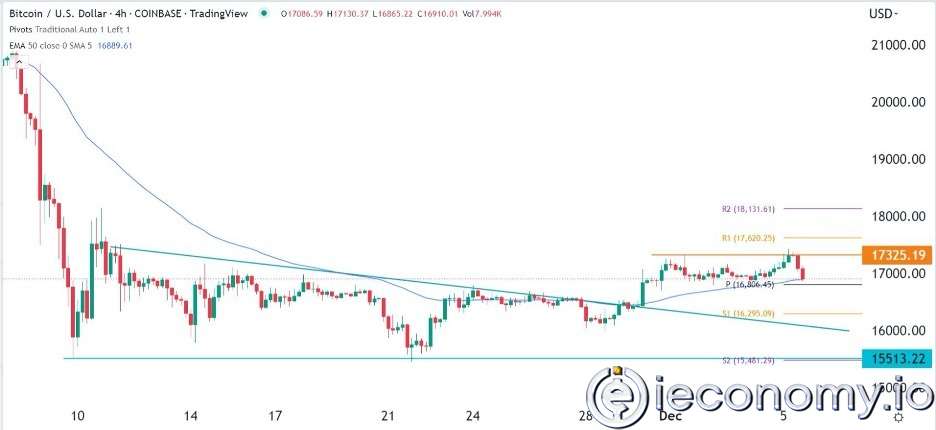
Forex Signal For BTC/USD: Downside Continues as Bitcoin Recovery Moves Less.
En Popüler Haberler
Yorum Yap
Yorumlar
Henüz yorum yapan yok! İlk yorumu siz yapın...