1805
0
Bitcoin Is Ready To Rise!
Bitcoin Is Ready To Rise! According to Bitcoin chart analysis, it seems that the worst part of the drop is over! Here are the details..
18.05.2021 22:49|ieconomy - Haber Merkezi

Yazar: Zack Smith
Yayınlanma: 18 Mayıs 2021 22:49
Güncellenme: 4 Temmuz 2026 11:43
Bitcoin Is Ready To Rise!
According to Bitcoin chart analysis, it seems that the worst part of the drop is over!
Bitcoin correction based on the relative strength index (RSI) could be ending. (RSI is a widely used technical indicator for determining momentum, overbought and overbought conditions.) The 14-week RSI is currently down to 53.00, a level that serves as a consistently solid support. It is also a level that continually serves as a solid support during the 2016-2017 bull run and marks the end of corrective retreats. RSI support has stepped in as Bitcoin has fallen from $ 64,801 to $ 42,000, or 35 percent, in the past four weeks. Although the tweets posted by Tesla CEO Elon Musk seem to have brought some retail investors to the gas to make sales, there were signs of exhaustion present in the market as well. Whales began to pull money from Bitcoin, while investors with less assets struggled hard not to lose weight over $ 60,000. However, the bull market continues to show solid signals, with the leading cryptocurrency up 365 percent year-on-year. There is also evidence that long-term investors are buying from the bottom. The strong support of the weekly RSI along with its historical background indicates that the leading cryptocurrency may soon continue its uptrend. At the time of writing, Bitcoin was trading at $ 45,450, an increase of around 4 percent during the day. As shown in the table above, Bitcoin had seen at least four key corrections during the 2016-2017 bull run that ended with a weekly RSI around 53.00. As the bank or exit level finally ended in January 2018, Bitcoin's entry into the bear market began. Following this, Bitcoin dropped to $ 3,200 after nearly a year of sales.
Since then, crossings above and below 53.00 have served as reliable indicators of bullish / bearish trends. The RSI kicked off the price rally, climbing above 53.00 in April 2019 and April 2020. However, falling below their levels in September 2019 and February 2020 also brought significant losses.
The weekly RSI is currently trading with strong support, while the daily RSI is signaling oversold with pressure below 30.
Technically speaking, the price finds some support from the 200-day exponential moving average (EMA), plus other momentum indicators such as the RSI show that the price is somewhat oversold, according to Simon Peters, crypto asset analyst at investment platform eToro. Peters said, "As we've seen before, investors waiting on the sideline are already using bottom selling to invest in crypto assets by taking advantage of the volatility."
On Monday, amid new fears that the Federal Reserve might reduce incentives to control inflation, the leading crypto could have a hard time drawing a V-shaped rally.
Bitcoin Is Ready To Rise!
Source: https://www.coindesk.com/
You may also be interested in:
Jack Dorsey Made Supportive Statement Regarding Bitcoin
As shown in the table above, Bitcoin had seen at least four key corrections during the 2016-2017 bull run that ended with a weekly RSI around 53.00. As the bank or exit level finally ended in January 2018, Bitcoin's entry into the bear market began. Following this, Bitcoin dropped to $ 3,200 after nearly a year of sales.
Since then, crossings above and below 53.00 have served as reliable indicators of bullish / bearish trends. The RSI kicked off the price rally, climbing above 53.00 in April 2019 and April 2020. However, falling below their levels in September 2019 and February 2020 also brought significant losses.
The weekly RSI is currently trading with strong support, while the daily RSI is signaling oversold with pressure below 30.
Technically speaking, the price finds some support from the 200-day exponential moving average (EMA), plus other momentum indicators such as the RSI show that the price is somewhat oversold, according to Simon Peters, crypto asset analyst at investment platform eToro. Peters said, "As we've seen before, investors waiting on the sideline are already using bottom selling to invest in crypto assets by taking advantage of the volatility."
On Monday, amid new fears that the Federal Reserve might reduce incentives to control inflation, the leading crypto could have a hard time drawing a V-shaped rally.
Bitcoin Is Ready To Rise!
Source: https://www.coindesk.com/
You may also be interested in:
Jack Dorsey Made Supportive Statement Regarding Bitcoin
İLGİLİ HABERLER
European stocks soared and focus shifted to German retail sales after Powell's speech!
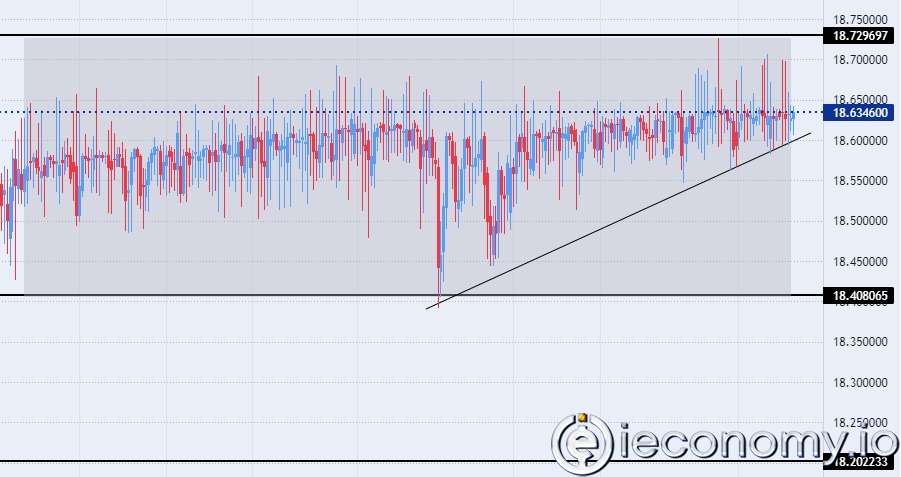
Forex Signal For TRY/USD: Inflation Slowdown in November.
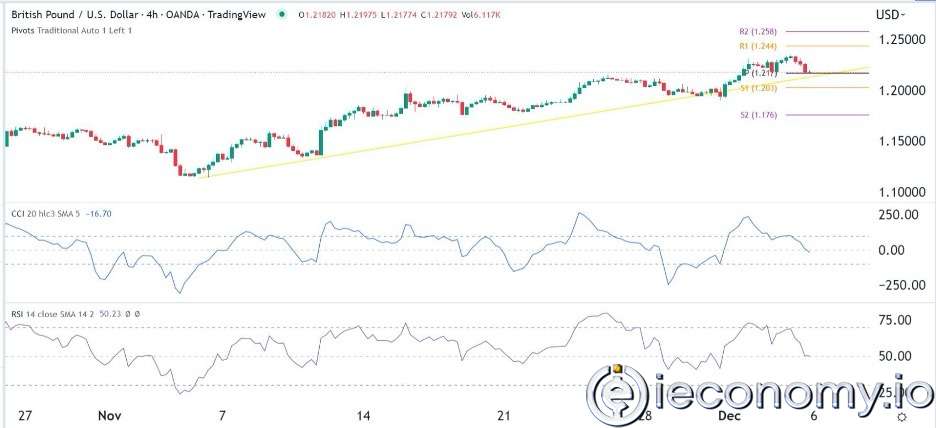
Forex Signal For GBP/USD: Bullish Trend Still Not Breaking While Recovery Continues.
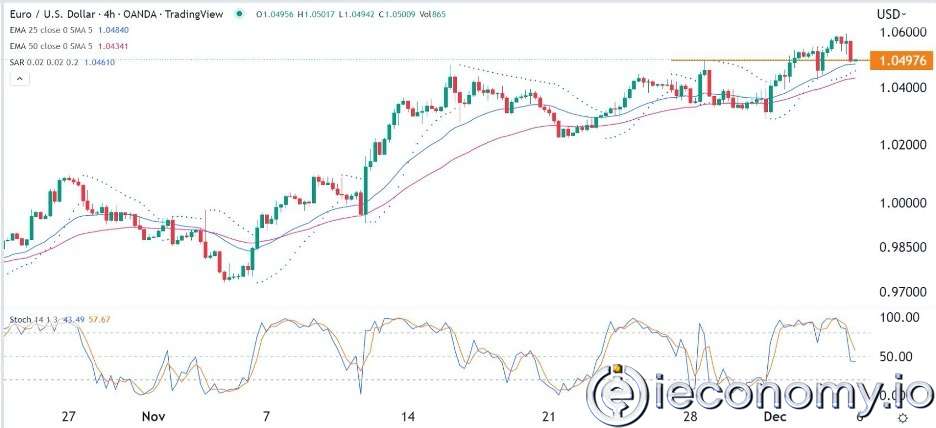
Forex Signal For EUR/USD: Starry US Data Points to Higher Fed Increases.
Forex Signal For BTC/USD: Downside Continues as Bitcoin Recovery Moves Less.
En Popüler Haberler
Yorum Yap
Yorumlar
Henüz yorum yapan yok! İlk yorumu siz yapın...