4610
0
Advice from Bitcoin Investor Who Had a Good Bear Season
In this article, we will take advice from a Bitcoin investor who had a good bear season. But remember, this is not investment advice.
Yazar: Eylem Özer
Yayınlanma: 11 Eylül 2021 12:43
Güncellenme: 19 Nisan 2024 09:15
Advice from Bitcoin Investor Who Had a Good Bear Season
In this article, we will take advice from a Bitcoin investor who had a good bear season. But before we get started, let me state that this is not investment advice.
Ekşi Sözlük writer 'unsealed', who has been trading in the cryptocurrency market for a long time, explained which factors are driving the market for investors who have just entered this market.'unsealed' started his post with the following:
" As someone who has been trading in this market for a long time and survived the bear season, I wonder what my answer would be if someone who has just started or does not have much experience asks me my clearest indicator of the course of the market. Let me share with you the moments when I paid the most attention and switched to cautious mode ..."'unsealed' explained the things that he paid attention to in 3 articles. First, "Funding Fee":
"Undisputed futures funding fees as the strongest indicator that everyone can easily access. Funding fee is actually the reflection of the issue of "you will buy when everyone is selling, you will sell when everyone is buying", it increases in the positive direction if too many long positions are opened on that paper/coin/token, and in the negative direction if too many short transactions are opened. Whenever the funding fee average of altcoins goes above 0.20, you see altcoins hovering above 0.30, understand that even if the direction is up, a very bloody interim correction "can happen". The opposite is also true, when you look at it, a lot of blood has flowed, liquidations have hit the ceiling, funding fees have hit the bottom, you have seen even a few negative funding while the majority is hovering around 0.01 and you wonder if the market will go down and you are afraid. Understand that that is most likely the buy level, if not, it is very close to the buy level. This indicator is so strong that even when Bitcoin reached 19-20k above the march dump and gained x6 value and most traders said the bullrun was over and closed their position, the bitcoin funding fee did not go above 0.01 until it reached 50k. With this math, you looked at the commodity in your hand, but the funding fee is still at low levels, understand that you are just at the beginning of that movement and it is not the futures market that inflates the price, it is spot purchases, the big ones are still collecting goods."The second is "Elliot's Waves". However, at this point, 'unsealed' states that you need to know the Elliot Wave Theory and states the following:
"Fourth wave fixes are the devil, you can never be sure where it will end until it's over. Look, I'm giving an example from the last dump; I had the Atom, the Cosmos, in my hand, I watched a very clean fourth wave hit the triangle, the wave structures fit, waves one-two-three-fourth are ok, before completing the fifth, I started a very clean five-wave impulsive movement, I said, truncate this fifth wave and broke the triangle up. I went to the place where I thought it was the beginning of the impulse, I put a stoploss, two days later and it exploded, it turned out that it was not a triangle or something, but a flat correction that took the B wave very wide. Never forget, the fourth wave can technically go all the way down to the top of the first wave, so always be cautious with what you believe to be the fourth wave corrections, it looks like it's over but the funding fees are still very high, there must be an expanded flat correction possibility. Keep that in mind, don't trade, wait. For those who are not greedy and can control themselves, the cleanest thing is to close the trade at the top of the third wave and take your profit, if you go too deep, you will open a position there, the position you will open will make you more money at least as much as you earn."Finally, the RSI indicator comes into play. 'unsealed' explains the RSI Indicator (Relative Strength Index) as follows:
"Preferably, bearish or bullish divergences formed on the charts of 4 hours and above "usually" work, 4-hours are for interim corrections. On the other hand, solid divergences formed in daily and above timeframes give healthy results in order to predict whether the movement is over or not. You don't know any technique, you trade by hearsay, learn to read the first and third items and trade by paying attention to the risk management rules."İLGİLİ HABERLER
European stocks soared and focus shifted to German retail sales after Powell's speech!
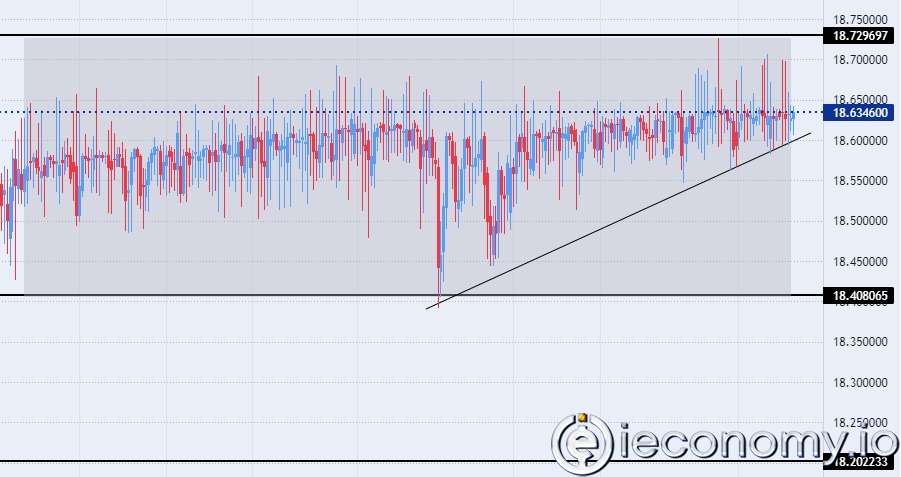
Forex Signal For TRY/USD: Inflation Slowdown in November.
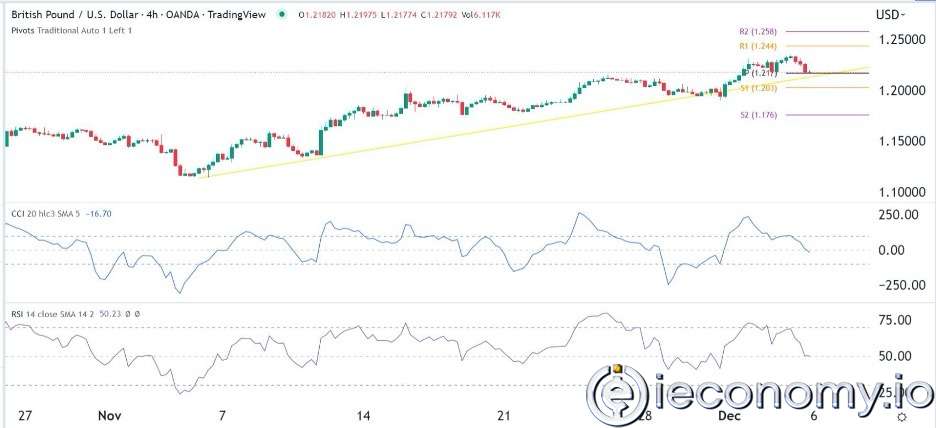
Forex Signal For GBP/USD: Bullish Trend Still Not Breaking While Recovery Continues.
Forex Signal For EUR/USD: Starry US Data Points to Higher Fed Increases.
Forex Signal For BTC/USD: Downside Continues as Bitcoin Recovery Moves Less.
En Popüler Haberler
Yorum Yap
Yorumlar
Henüz yorum yapan yok! İlk yorumu siz yapın...