4141
0
How to Do Dollar Technical Analysis? What is the Dollar Technical Analysis Chart?
Technical analysis is one of the topics that every prospective investor who wants to invest in the stock market or Forex must know...
22.07.2022 00:50|ieconomy - Haber Merkezi
Yazar: James Gordon
Yayınlanma: 22 Temmuz 2022 00:50
Güncellenme: 11 Temmuz 2026 01:58
How to Do Dollar Technical Analysis? What is the Dollar Technical Analysis Chart?
Technical analysis is one of the topics that every prospective investor who wants to invest in the stock market or Forex must know. All investors want to make a profit from their investments. This can be achieved through good analysis, chart reading and research. One of the ways to correctly interpret the course of the markets is to be able to perform technical analysis.
The Central Bank defines the term 'Technical Analysis' as '' It is the process of analyzing past market movements based on indicators such as price and volume and thus making price forecasts for the future. For this purpose, various graphical formations and statistical methods are utilized. It is based on the assumption that the formations on the charts due to past price movements are indicators for the future, and therefore such formations can be used as indicators for trading. This type of analysis, for example, predicts that the lowest prices in the past, in other words, the points where prices start to rise, are "support points" and therefore should be expected (criteria) for buying, and that the highest prices in the past are "resistance" points and should be considered for selling. There are a number of tools to assist traders when conducting technical analysis. With these tools, traders can predict the price direction and possible trading levels on the chart of the relevant instrument. The trader performing technical analysis should also take into account volatility, maturity, trading volume and the overall market situation. Therefore, technical analysis alone is not sufficient to make investment decisions, but it is important to use it together with fundamental analysis in order to make healthier investment decisions.Dollar TL technical analysis;
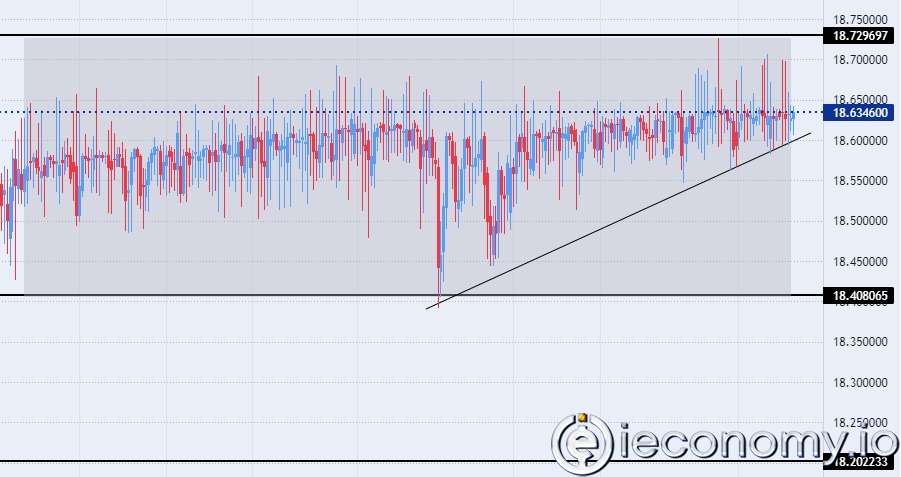
It is called the technical analysis put forward by following the Dollar / TL parity. It is among the exotic pairs that Turkish investors trade the most in the Forex market. The exchange rate, which consists of the US currency Dollar and Turkey's currency TRY, which has a strong place among the economies of developing countries, is among the most preferred instruments in short positions due to its high volatility.Euro Dollar technical analysis;
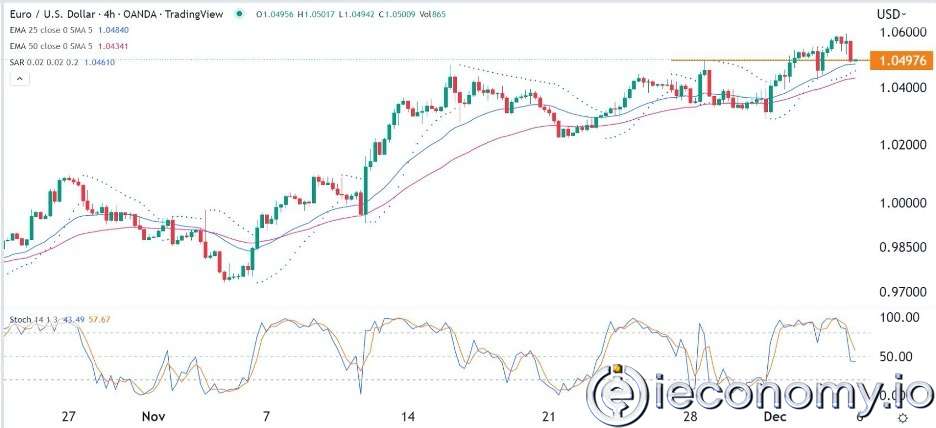
The Eur/Usd pair, recorded as the most traded currency pair in global money markets, consists of the US currency Dollar and the Euro, the common currency of the Euro Union. The Eur/Usd pair is defined as a major pair where the Euro is the base currency and the Dollar is the counter currency. The Eur/Usd pair is affected by decisions such as European (ECB) and US Federal Reserve (FED) statements, FOMC meeting minutes, highly important data from the Eurozone and the US (growth rate, non-farm employment, unemployment rate, retail sales).Gold Dollar technical analysis;
The Gram Gold Dollar (GAUUSD) contract, which allows investment in gram gold prices in the Forex market, is an innovative product developed by GCM Forex. The Gram Gold-Dollar investment instrument is a value that allows the investor to trade in the Forex market 5 days a week, 24 hours a day in the open market, while prices are both rising and falling, and to benefit from the opportunity of two-way investment.Dollar exchange rate technical analysis - dollar instant technical analysis - dollar index technical analysis;
The US Dollar Index is based on the strength of the dollar against a number of major currencies. The DXY was first developed by the US Federal Reserve in 1973 to provide a trade-weighted average value of the US dollar against global currencies. The US Dollar Index rises when the US Dollar gains "strength" (value) relative to other currencies. The investment information, comments and recommendations contained herein do not constitute investment advice. Investment advisory services are provided on a personalized basis, taking into account the risk and return preferences of individuals. The content, comments and recommendations contained herein, which are in no way directive in nature, are of a general nature. These recommendations may not be suitable for your financial situation and risk and return preferences. Therefore, making an investment decision based solely on the information contained herein may not produce results in line with your expectations.
İLGİLİ HABERLER
European stocks soared and focus shifted to German retail sales after Powell's speech!
Forex Signal For TRY/USD: Inflation Slowdown in November.
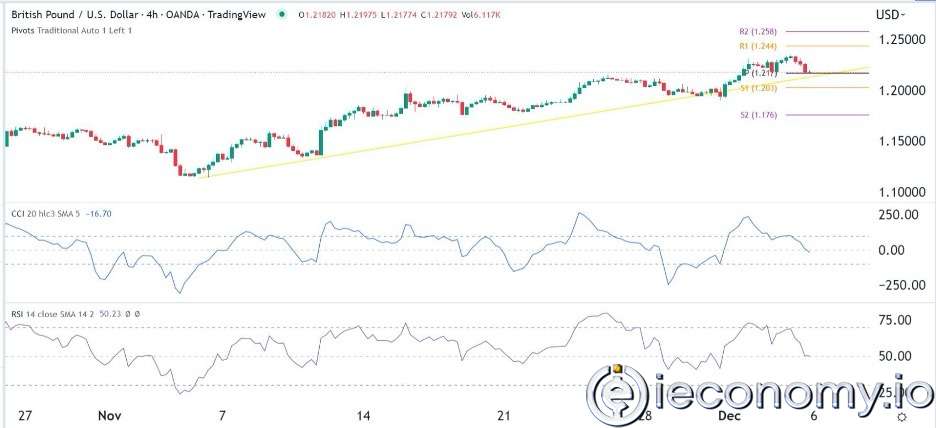
Forex Signal For GBP/USD: Bullish Trend Still Not Breaking While Recovery Continues.
Forex Signal For EUR/USD: Starry US Data Points to Higher Fed Increases.
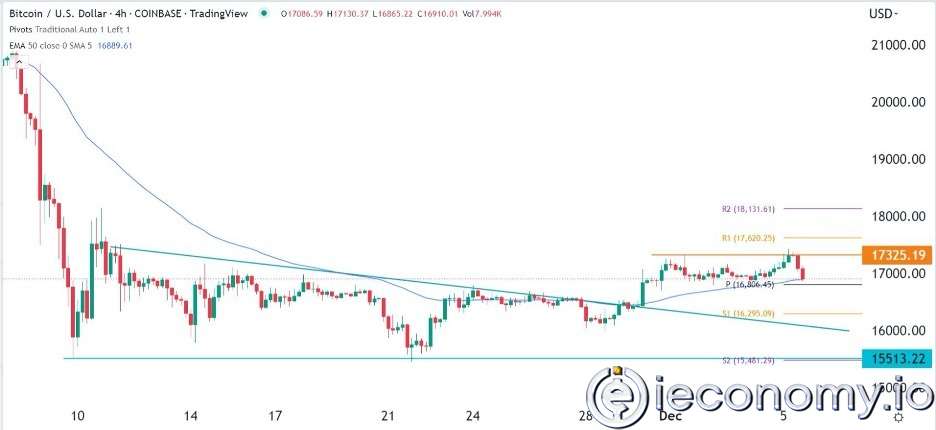
Forex Signal For BTC/USD: Downside Continues as Bitcoin Recovery Moves Less.
En Popüler Haberler
Yorum Yap
Yorumlar
Henüz yorum yapan yok! İlk yorumu siz yapın...