11843
0
How to Trade At All-Time Highs and Lows
How to Trade At All-Time Highs and Lows ; How to Trade At All-Time Highs and Lows

Yazar: Zack Smith
Yayınlanma: 20 Ocak 2021 19:39
Güncellenme: 6 Nisan 2024 13:59
How to Trade At All-Time Highs and Lows
How to Trade At All-Time Highs and Lows?Introduction!
Normally, when we identify resistance or support levels, we look at previous lows or highs to make these adjustments. For example, on the H4 chart below, the GBP / USD pair has been spinning at 1.33 for a while, so it would be wise to choose this level as a tactical support point. Very practical, right? Basically, you trade with the past performance of the asset. Let's Assume!
What if the currency pair reaches a region where it has never been before, namely an undiscovered region?
This is the case for the daily USD / TRY pair in the chart below. Although 7.50 support and 8.50 resistance are easily set, this can only work in local, intraday trading and when the currency pair is below 8.50 resistance.
But what if it reaches 8.50 again and surpasses it? How do you adjust the resistance levels?
Let's Assume!
What if the currency pair reaches a region where it has never been before, namely an undiscovered region?
This is the case for the daily USD / TRY pair in the chart below. Although 7.50 support and 8.50 resistance are easily set, this can only work in local, intraday trading and when the currency pair is below 8.50 resistance.
But what if it reaches 8.50 again and surpasses it? How do you adjust the resistance levels?
 Hypothesis!
The first thing to check is a larger time frame. Sometimes, you can't see the price-performance enough by looking back: It can be very difficult to see the lowest or highest of multiple years on the H4 or daily chart. Therefore, you need to switch to a weekly or monthly time frame. However, the monthly chart below for the USD / TRY parity shows that the price has never risen this much in the last twenty years.
So what should be done? How is the resistance level set here?
Hypothesis!
The first thing to check is a larger time frame. Sometimes, you can't see the price-performance enough by looking back: It can be very difficult to see the lowest or highest of multiple years on the H4 or daily chart. Therefore, you need to switch to a weekly or monthly time frame. However, the monthly chart below for the USD / TRY parity shows that the price has never risen this much in the last twenty years.
So what should be done? How is the resistance level set here?

Stages to be Followed
Basic Knowledge What you have to do is to make a graphic projection. But before doing this, you must make sure that no change in the underlying layout is expected for your asset. It's like planning a route in a sea: you arrive where you follow a certain trend. If the wind changes, the trend also changes - this will take you in a completely different direction that you could not plan for. So, assuming the winds keep blowing in the same direction as they have been before, you can only predict your future position. Speed Now observe the speed that the trajectory of your asset follows. You can't really predict accelerations or slowdowns, so the only way to reflect the price action into the medium-term and long-term future is to assume that it is on average at the same pace. After doing that, you will now have an expected price action chart on your screen that can help you identify appropriate resistance or support levels. The goal is complete. Practice For example, the daily chart for the USD / TRY pair below. For extrapolation (a statistical method for predicting the future based on figures from previous years), we basically take the upward trajectory marked in the square on the left. This is normal behavior that happens without any big news or big market movement happening. We now assume that it will follow a similar trajectory in the medium term. When we chart it, it doesn't have to be exactly the same: we just make a prediction of what the most likely scenario is for the USD / TRY pair under the same underlying conditions. Now we set the resistance at 9.00 and make our transaction (trade) plans based on this. The same works for downward motions. Reality
Note that this approach is more applicable for medium term and long term forecasts. While the short term is heavily affected by intraday movements and temporary market enthusiasm, the long term ignores these noises. Also, keep in mind that you should include approximate fixes and retractions in your plan. Otherwise, you may have an ideal (!) Scenario or smooth (!) Flat curves that give unrealistic expectations of price behavior.
Result
In line with the aforementioned stages, if you have all-time highs or lows and no benchmarks appear to be valid in the asset's previous performance, follow these steps:
1- Check the basic layout. If the basics are expected to remain the same for the foreseeable future, it may be providing enough ground for you to assume that the current movement trajectory can be reflected in the medium term plan.
2- Check the pattern and speed of movement of the asset. See how much the slope bends, local bends and corrections pass. Transfer your result from these data into the medium-term future.
3- According to this plan, watch out for resistance / support and zone levels. Now, your target is complete and you can trade at the expected levels.
How to Trade At All-Time Highs and Lows?
You may also be interested in:
Reality
Note that this approach is more applicable for medium term and long term forecasts. While the short term is heavily affected by intraday movements and temporary market enthusiasm, the long term ignores these noises. Also, keep in mind that you should include approximate fixes and retractions in your plan. Otherwise, you may have an ideal (!) Scenario or smooth (!) Flat curves that give unrealistic expectations of price behavior.
Result
In line with the aforementioned stages, if you have all-time highs or lows and no benchmarks appear to be valid in the asset's previous performance, follow these steps:
1- Check the basic layout. If the basics are expected to remain the same for the foreseeable future, it may be providing enough ground for you to assume that the current movement trajectory can be reflected in the medium term plan.
2- Check the pattern and speed of movement of the asset. See how much the slope bends, local bends and corrections pass. Transfer your result from these data into the medium-term future.
3- According to this plan, watch out for resistance / support and zone levels. Now, your target is complete and you can trade at the expected levels.
How to Trade At All-Time Highs and Lows?
You may also be interested in:
Which Indicators Should Be Preferred for the Right Investment?
İLGİLİ HABERLER
European stocks soared and focus shifted to German retail sales after Powell's speech!
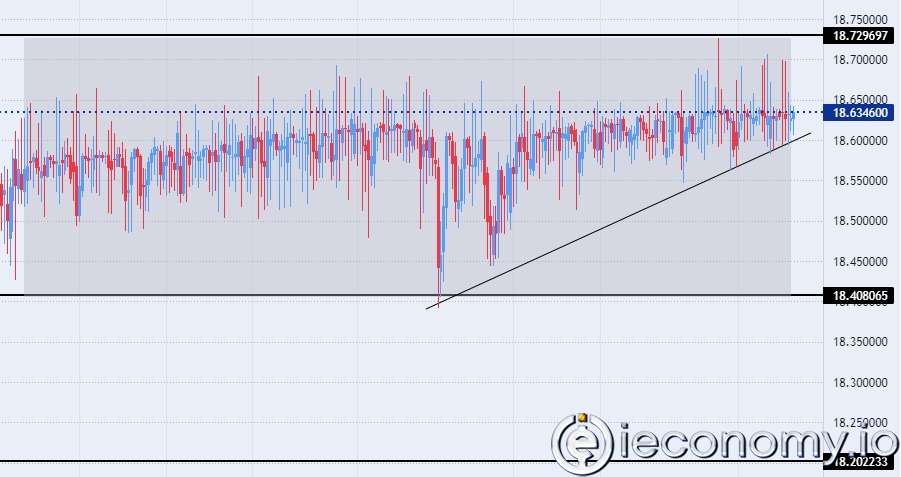
Forex Signal For TRY/USD: Inflation Slowdown in November.
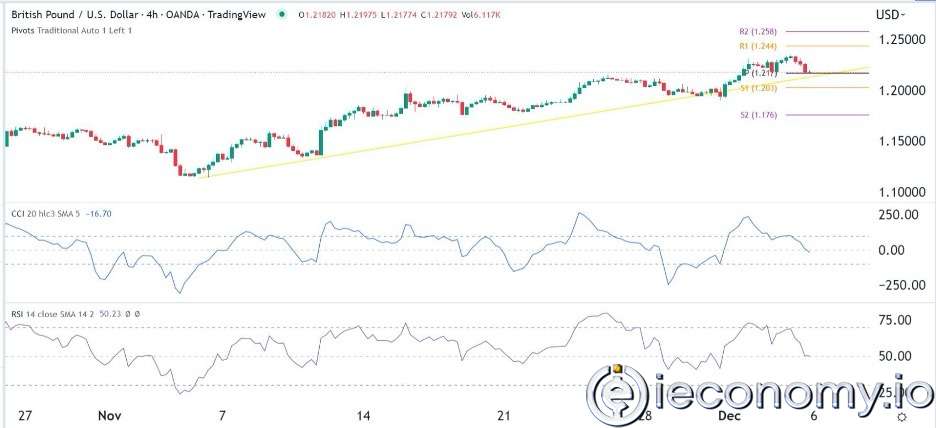
Forex Signal For GBP/USD: Bullish Trend Still Not Breaking While Recovery Continues.
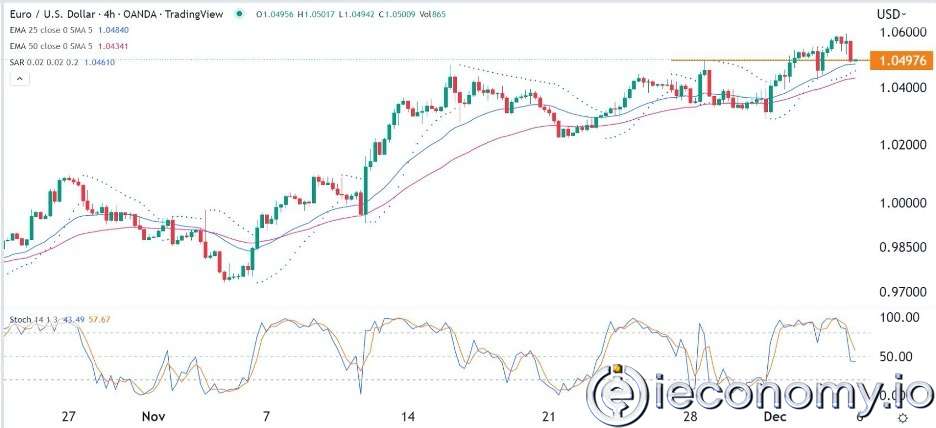
Forex Signal For EUR/USD: Starry US Data Points to Higher Fed Increases.
Forex Signal For BTC/USD: Downside Continues as Bitcoin Recovery Moves Less.
En Popüler Haberler
Yorum Yap
Yorumlar
Henüz yorum yapan yok! İlk yorumu siz yapın...