3329
0
What are Candlestick Charts Used in Technical Analysis?
Charts that reveal a specific time period are called candlestick charts. Candlestick charts are created by taking into account the opening...
Yazar: James Gordon
Yayınlanma: 22 Temmuz 2022 00:42
Güncellenme: 10 Nisan 2024 16:46
What are Candlestick Charts Used in Technical Analysis?
Charts that reveal a specific time period are called candlestick charts. Candlestick charts are created by taking into account the opening and closing prices of a financial asset's low and high. What are bullish candlestick patterns, stock market candlestick patterns used in the markets?
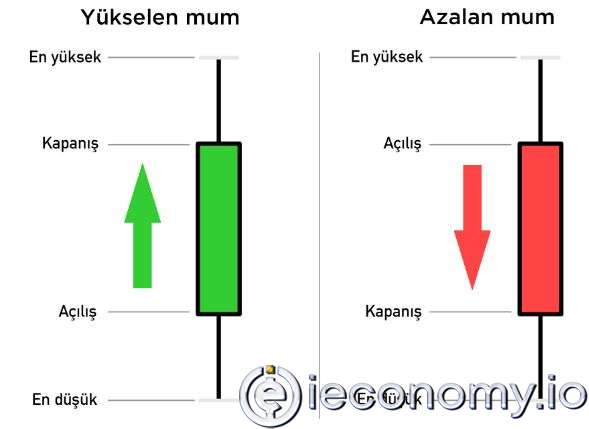
Candlestick charts are used by many analysts. This chart was first developed by the Japanese. Also referred to as candlestick patterns, candlestick charts are common in all markets. A candlestick chart is a chart pattern that shows the lowest, highest, opening and closing prices of an asset over a period of time. The difference between the opening and closing prices is represented by a candlestick chart in the stock market. Since each candlestick on the chart provides more than one piece of information about the price of the asset over the time period, it is a helpful analysis that, when read correctly, also gives an idea about the current trend. Candles basically consist of a body and a wick/tail, with a red candle indicating a downtrend and a green candle indicating an uptrend. A general view of a candlestick pattern chart:
Candlestick patterns used in technical analysis:
Hammer
This type of candle is observed during a period of time when the price makes a low and then pulls back up with buying. The hammer can be red or green, but green hammers may indicate a stronger bullish reaction. The tail below the candle is much longer than the wick above. This means that there was heavy selling during the time frame, but there was an increase in investor buying to push the price up.Inverted Hammer
Also known as a reverse hammer, it is similar to a hammer but the long wick is on top of the body instead of below it. Similar to the hammer, the upper wick should be at least twice as long as the body. It is noted that even though the price declined, the market tested higher levels during the time frame, but with increased selling, the price closed lower.Three White Soldiers
This chart consists of three consecutive green candles, each opening within the body range of the previous candle and closing at a point that exceeds the high of that candle. Ideally, these candle blocks should have no lower wicks, indicating that continued buying pressure is pushing the price up. The size of the candles and the length of the wicks can be used to determine the likelihood of continuation or a possible trend change.Doji
A Doji occurs when the opening and closing price are the same (or very close). The price can move above and below the open, but the close is close to the open. The Doji can therefore indicate a point of indecision between buying and selling forces. Nevertheless, the interpretation of Doji is closely related to the context.Dragonfly Doji Candle
It is described as a bearish or bullish (depending on the context) candle with a long lower wick and the open/close near the upper end. The opening and closing prices, which are very close or equal to each other, are observed at high price levels within the time frame.Gravestone Doji Candle
In this way, very close or equal opening and closing prices are seen at the lows of the day. A lengthening wick indicates a bearish trend. A bearish reversal candle with a long upper wick and a close open/close near the lower end.The most reliable candlestick patterns
Not all candlestick patterns are equally reliable/unreliable. Their increasing popularity can lead to some decline in reliability. 'Candlestick patterns pdf' The investment information, comments and recommendations contained herein do not constitute investment advice. Investment advisory services are provided on a personalized basis, taking into account the risk and return preferences of individuals. The content, comments and recommendations contained herein, which are in no way directive in nature, are of a general nature. These recommendations may not be suitable for your financial situation and risk and return preferences. Therefore, making an investment decision based solely on the information contained herein may not produce results in line with your expectations.İLGİLİ HABERLER
European stocks soared and focus shifted to German retail sales after Powell's speech!
Forex Signal For TRY/USD: Inflation Slowdown in November.
Forex Signal For GBP/USD: Bullish Trend Still Not Breaking While Recovery Continues.
Forex Signal For EUR/USD: Starry US Data Points to Higher Fed Increases.
Forex Signal For BTC/USD: Downside Continues as Bitcoin Recovery Moves Less.
En Popüler Haberler
Yorum Yap
Yorumlar
Henüz yorum yapan yok! İlk yorumu siz yapın...