1426
0
What is Ichimoku Indicator?
What is Ichimoku Indicator? Ichimoku, one of the trend tracking indicators; It was created by Japanese journalist Goichi Hosoda in the 1930s, and became widespread in the 60s after the long testing phase was completed.
Yazar: Müzeyyen D
Yayınlanma: 4 Ağustos 2020 15:38
Güncellenme: 25 Nisan 2024 00:58
Ichimoku, one of the trend tracking indicators; It was created by Japanese journalist Goichi Hosoda in the 1930s, and became widespread in the 60s after the long testing phase was completed.
The reason why it is one of the most frequently used indicators today is that it can be used alone, unlike other indicators. As we mentioned in our previous articles, a single indicator is not sufficient to make a market forecast, different indicators must be used to evaluate more than one condition and to verify the forecast. However, Ichimoku is one of the exceptions.
Although this indicator, which means 'a look' as its origin, seems complicated, it actually enables the analysis of the stock or index in a short time.
What are the components of the Ichimoku Indicator? How is it interpreted?
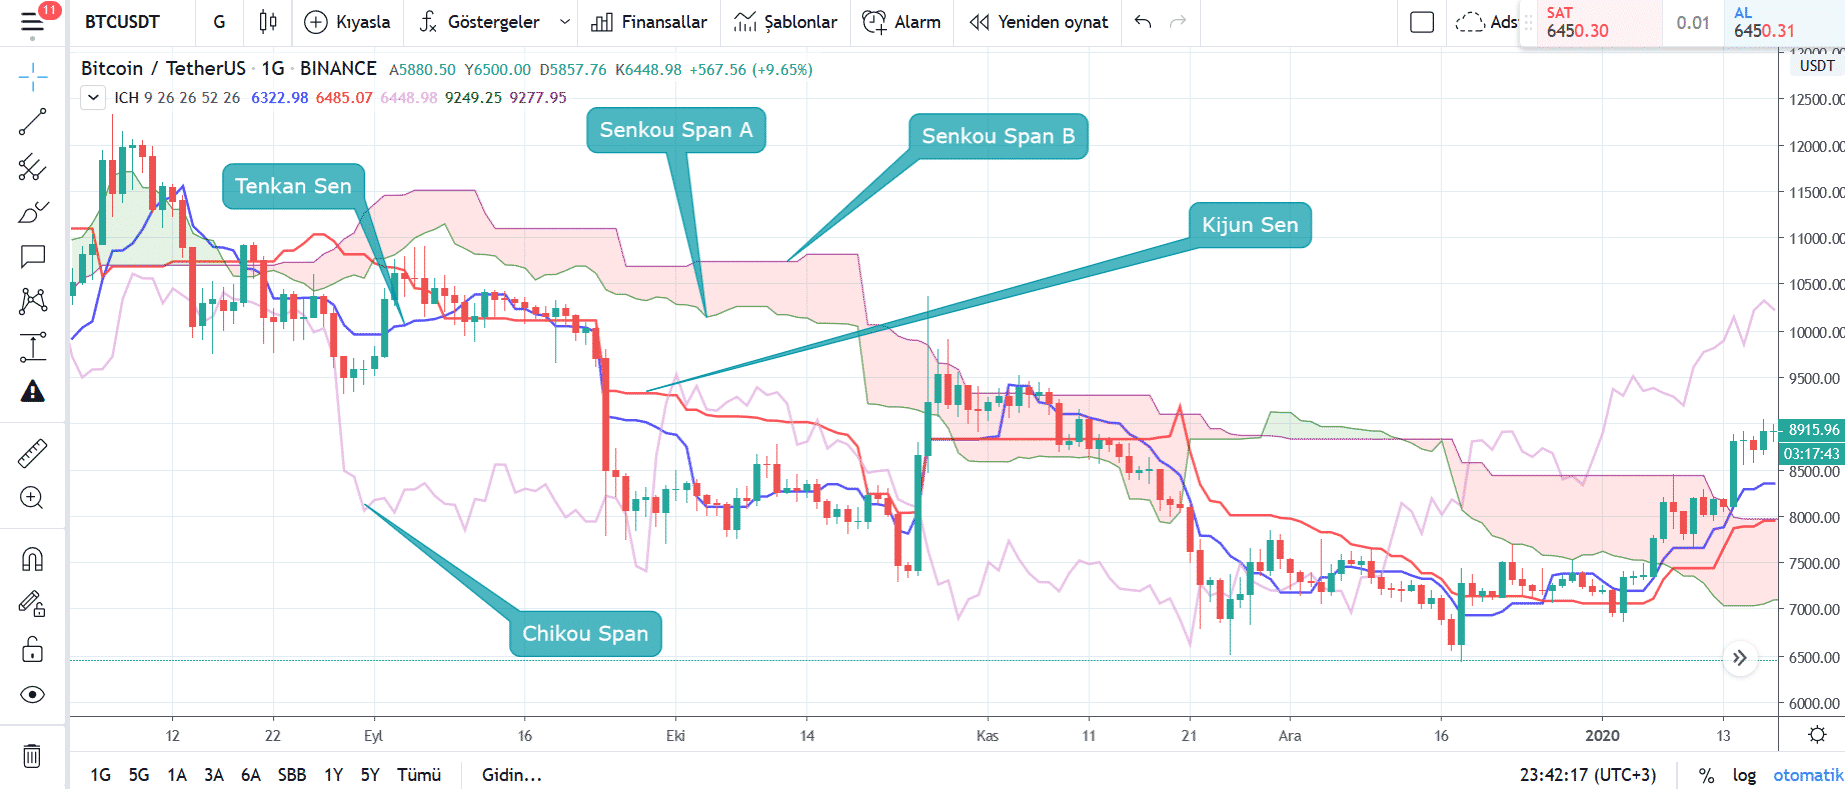
Ichimoku contains 5 different components and these components provide a comprehensive analysis of the index or stock in question.
 Tenkan Sen (Turning / Conversion Line) Return Line
It is the moving average of the highest and lowest values in 9 historical periods.
When the Turn Line crosses the Standard Line upwards, it is considered as the BUY signal,
If the Turn Line crosses the Standard Line downwards, it is considered as the SELL signal.
Kijun Sen (Standard / Base line) Standard Line
• It is an important support and resistance level indicator.
• It is the moving average of the highest and lowest values in 26 retrospective periods.
• When it comes to long flats, it indicates that prices fluctuate within a certain range, that is, market volatility.
Senkou Span A (Leading Span1)
When we described the Ichimoku Indicator, we mentioned that this chart alone allows investors to guess. This is mainly thanks to Leading Spans. Leading Spans gives an idea about the future movement of the stock in question.
Leading Span 1 is the values of the Turn and Standard Line shifted forward by 26 periods.
Senkou Span B (Leading Span2)
Leading Span 2 averages the highest and lowest values of the last 52 periods and shifts 26 periods ahead.
Leading Span 1 and 2 together form the Ichimoku Cloud.
• If the price is above the cloud, Leading Span1 and 2 work as SUPPORT.
It indicates that prices will move upwards.
• In case the price is under the cloud, Leading Span1 and 2 work as RESISTANCE.
It indicates that prices will move down.
• The fact that the price is in the cloud indicates the instability in the market.
Chikou Span (Lagging Span)
The price is taken back 26 days. If the value obtained is above the previous period of 26 periods, it is interpreted as a bull and below it as a bear market.
Tenkan Sen (Turning / Conversion Line) Return Line
It is the moving average of the highest and lowest values in 9 historical periods.
When the Turn Line crosses the Standard Line upwards, it is considered as the BUY signal,
If the Turn Line crosses the Standard Line downwards, it is considered as the SELL signal.
Kijun Sen (Standard / Base line) Standard Line
• It is an important support and resistance level indicator.
• It is the moving average of the highest and lowest values in 26 retrospective periods.
• When it comes to long flats, it indicates that prices fluctuate within a certain range, that is, market volatility.
Senkou Span A (Leading Span1)
When we described the Ichimoku Indicator, we mentioned that this chart alone allows investors to guess. This is mainly thanks to Leading Spans. Leading Spans gives an idea about the future movement of the stock in question.
Leading Span 1 is the values of the Turn and Standard Line shifted forward by 26 periods.
Senkou Span B (Leading Span2)
Leading Span 2 averages the highest and lowest values of the last 52 periods and shifts 26 periods ahead.
Leading Span 1 and 2 together form the Ichimoku Cloud.
• If the price is above the cloud, Leading Span1 and 2 work as SUPPORT.
It indicates that prices will move upwards.
• In case the price is under the cloud, Leading Span1 and 2 work as RESISTANCE.
It indicates that prices will move down.
• The fact that the price is in the cloud indicates the instability in the market.
Chikou Span (Lagging Span)
The price is taken back 26 days. If the value obtained is above the previous period of 26 periods, it is interpreted as a bull and below it as a bear market.
 Meta Trader 4 / Meta Trader 5 is the most widely used online trading platform worldwide Its simple interface makes it easy to keep track of complicated transactions.In the application you can download to your computer, tablet or phone. Simply select what you want to follow from the indicators on the left side of the screen and drag it to the main screen.Multiple indicators can be observed and analyzed simultaneously and also indicator can be customized easily.

Tenkan Sen (Turning / Conversion Line) Return Line
It is the moving average of the highest and lowest values in 9 historical periods.
When the Turn Line crosses the Standard Line upwards, it is considered as the BUY signal,
If the Turn Line crosses the Standard Line downwards, it is considered as the SELL signal.
Kijun Sen (Standard / Base line) Standard Line
• It is an important support and resistance level indicator.
• It is the moving average of the highest and lowest values in 26 retrospective periods.
• When it comes to long flats, it indicates that prices fluctuate within a certain range, that is, market volatility.
Senkou Span A (Leading Span1)
When we described the Ichimoku Indicator, we mentioned that this chart alone allows investors to guess. This is mainly thanks to Leading Spans. Leading Spans gives an idea about the future movement of the stock in question.
Leading Span 1 is the values of the Turn and Standard Line shifted forward by 26 periods.
Senkou Span B (Leading Span2)
Leading Span 2 averages the highest and lowest values of the last 52 periods and shifts 26 periods ahead.
Leading Span 1 and 2 together form the Ichimoku Cloud.
• If the price is above the cloud, Leading Span1 and 2 work as SUPPORT.
It indicates that prices will move upwards.
• In case the price is under the cloud, Leading Span1 and 2 work as RESISTANCE.
It indicates that prices will move down.
• The fact that the price is in the cloud indicates the instability in the market.
Chikou Span (Lagging Span)
The price is taken back 26 days. If the value obtained is above the previous period of 26 periods, it is interpreted as a bull and below it as a bear market.
How to Add Ichimoku Indicator?
It is possible to add and follow the indicators through the Meta Trader platform, which is traded online in Forex and Stock market.
Meta Trader 4 / Meta Trader 5 is the most widely used online trading platform worldwide Its simple interface makes it easy to keep track of complicated transactions.In the application you can download to your computer, tablet or phone. Simply select what you want to follow from the indicators on the left side of the screen and drag it to the main screen.Multiple indicators can be observed and analyzed simultaneously and also indicator can be customized easily.
İLGİLİ HABERLER
European stocks soared and focus shifted to German retail sales after Powell's speech!
Forex Signal For TRY/USD: Inflation Slowdown in November.
Forex Signal For GBP/USD: Bullish Trend Still Not Breaking While Recovery Continues.
Forex Signal For EUR/USD: Starry US Data Points to Higher Fed Increases.
Forex Signal For BTC/USD: Downside Continues as Bitcoin Recovery Moves Less.
En Popüler Haberler
Yorum Yap
Yorumlar
Henüz yorum yapan yok! İlk yorumu siz yapın...