3822
0
Which Indicators Should Be Preferred for the Right Investment?
What is an indicator? Which indicator should be preferred in which situations? What are the indicators to be preferred for the right invest
Yazar: Müzeyyen D
Yayınlanma: 19 Ocak 2021 15:51
Güncellenme: 12 Nisan 2024 12:27
Which Indicators Should Be Preferred for the Right Investment?

What is an Indicator?
 Financial investment forecasts are made based on observation of past movements through technical analysis. Indicators are technical analysis 'indicators' in the simplest sense. In other words, mathematical models that give investors an idea about price direction and trend continuation in the markets are called indicators.
What are the Most Important Types of Indicators?
 Indicators help investors by giving buy or sell signals about stocks by using data and volume data in the price calculation. Indicators may not always give accurate results to make trading decisions on their own. Here are the most frequently used and most accurate indicators in the market;
1-RSI Indicator (Relative Strength Index): RSI Indicator was published in 1978 by J. Welles Wilder. It is an indicator used to detect whether the price action in the financial statement is overbought or oversold.
2-MACD Indicator (Moving Average Convergence Divergence): It is one of the most frequently used indicators in technical analysis. It was discovered by Gerald Appel in 1979. It is an indicator that is based on moving averages and gives an idea about the direction of the trend.
3-CCI Indicator (Commodity Channel Index): It is an indicator developed for commodity markets. It was discovered by Donald R. Lambert. The most important feature is that it can catch the beginning of the trend in the markets that follow a horizontal course. CCI Indicator̈ is calculated by adding the lowest, highest, and closinģ values of the specified period and dividing by three.
4) Stochastic Indicator (Stochastic Oscillator): It is the oscillator that calculates according to the closeness of this slice to the highest and lowest values.
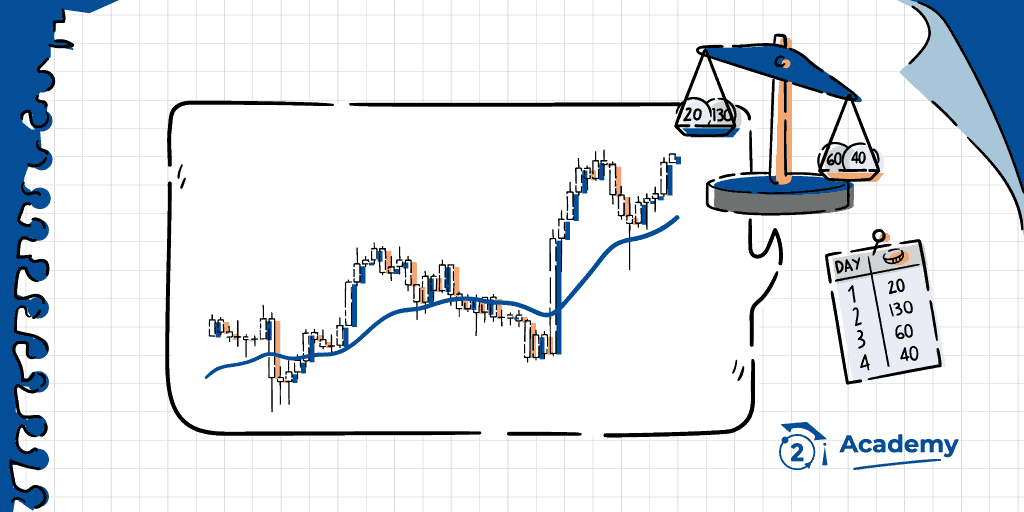
5) Moving Averages: The indicator that calculates the average closing price of an asset for a certain period of time is called a moving average (Moving Average, MA) or simple moving average (SMA). The moving average gives an idea about the direction of the market by subtracting the average value from the historical price data.
6) Bollinger Bands (Bollinger Bands): Bollinger Bands (BB) is a common technical analysis tool created by John Bollinger in the early 1980s. Bollinger Bands consist of a three-line band drawn according to the price of the security. The middle line is usually the Simple Moving Average (SMA) set to a 20-day period (trendline and period can be changed by the trader, but the 20-day moving average is the most popular).
Indicators help investors by giving buy or sell signals about stocks by using data and volume data in the price calculation. Indicators may not always give accurate results to make trading decisions on their own. Here are the most frequently used and most accurate indicators in the market;
1-RSI Indicator (Relative Strength Index): RSI Indicator was published in 1978 by J. Welles Wilder. It is an indicator used to detect whether the price action in the financial statement is overbought or oversold.
2-MACD Indicator (Moving Average Convergence Divergence): It is one of the most frequently used indicators in technical analysis. It was discovered by Gerald Appel in 1979. It is an indicator that is based on moving averages and gives an idea about the direction of the trend.
3-CCI Indicator (Commodity Channel Index): It is an indicator developed for commodity markets. It was discovered by Donald R. Lambert. The most important feature is that it can catch the beginning of the trend in the markets that follow a horizontal course. CCI Indicator̈ is calculated by adding the lowest, highest, and closinģ values of the specified period and dividing by three.
4) Stochastic Indicator (Stochastic Oscillator): It is the oscillator that calculates according to the closeness of this slice to the highest and lowest values.
5) Moving Averages: The indicator that calculates the average closing price of an asset for a certain period of time is called a moving average (Moving Average, MA) or simple moving average (SMA). The moving average gives an idea about the direction of the market by subtracting the average value from the historical price data.
6) Bollinger Bands (Bollinger Bands): Bollinger Bands (BB) is a common technical analysis tool created by John Bollinger in the early 1980s. Bollinger Bands consist of a three-line band drawn according to the price of the security. The middle line is usually the Simple Moving Average (SMA) set to a 20-day period (trendline and period can be changed by the trader, but the 20-day moving average is the most popular).
Which Indicator Should be Preferred in Which Situations?
 Investors who are willing to make an investment choice by conducting their own analysis have to use these indicators. Although evaluating the indicators requires professionalism, it is possible for investors to benefit from these graphics with the right training. One of the important points to be considered here is that indicators alone are not sufficient to make an investment decision. The trader, who trades in financial markets, should evaluate the indicators and make a decision on his or her own initiative. In addition, the investor should use more than one indicator.
Technical Indicators
What are The Indicators to be Preferred for The Right Investment?
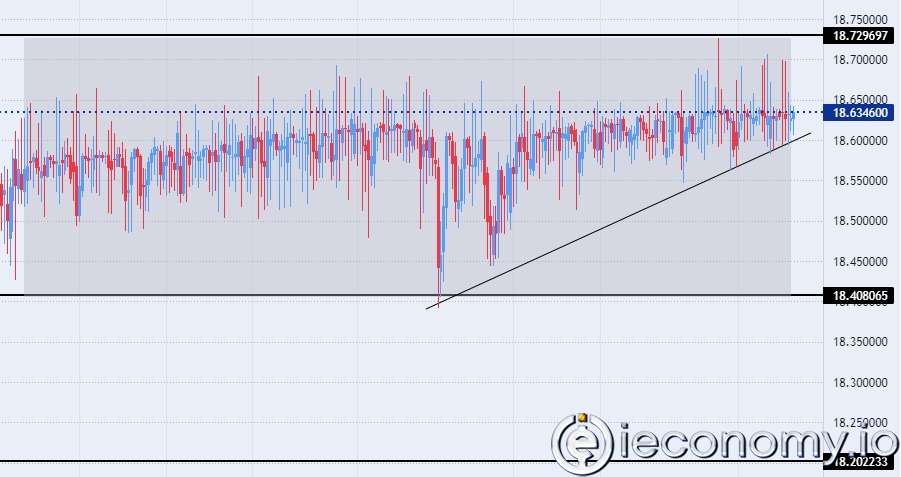
 While using more than one indicator, the investors may make some mistakes in order to verify the result they want to see. Looking at indicators that produce the same type of signal may cause you to receive too many signals and make mistakes when interpreting the results. Instead of indicators that say the same thing in different ways, compatible indicators should be preferred. For example; The stochastic indicator (displays momentum) and ADX (trend indicator) can be used. You can easily use these indicators to compare one another.
Another factor that can cause you to make a wrong decision is to use many indicators over and over without making the necessary arrangements. To avoid this situation, you can use multiple monitors, group the indicators, or customize the design features of the graphics to make it easier to distinguish from one another.
'Which Indicators Should I Prefer for the Right Investment?' To get an answer to the question, you can review our content, where we discuss popular indicators in detail.
What is an indicator?
What is Momentum Indicator?
While using more than one indicator, the investors may make some mistakes in order to verify the result they want to see. Looking at indicators that produce the same type of signal may cause you to receive too many signals and make mistakes when interpreting the results. Instead of indicators that say the same thing in different ways, compatible indicators should be preferred. For example; The stochastic indicator (displays momentum) and ADX (trend indicator) can be used. You can easily use these indicators to compare one another.
Another factor that can cause you to make a wrong decision is to use many indicators over and over without making the necessary arrangements. To avoid this situation, you can use multiple monitors, group the indicators, or customize the design features of the graphics to make it easier to distinguish from one another.
'Which Indicators Should I Prefer for the Right Investment?' To get an answer to the question, you can review our content, where we discuss popular indicators in detail.
What is an indicator?
What is Momentum Indicator?İLGİLİ HABERLER
European stocks soared and focus shifted to German retail sales after Powell's speech!
Forex Signal For TRY/USD: Inflation Slowdown in November.
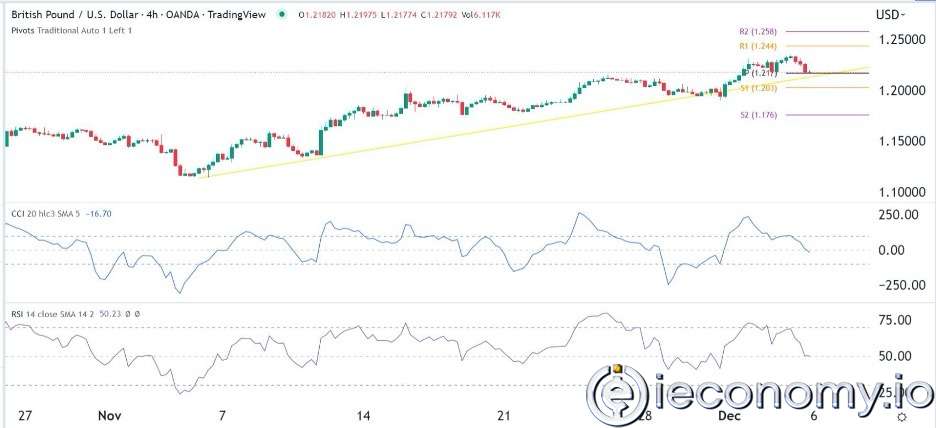
Forex Signal For GBP/USD: Bullish Trend Still Not Breaking While Recovery Continues.
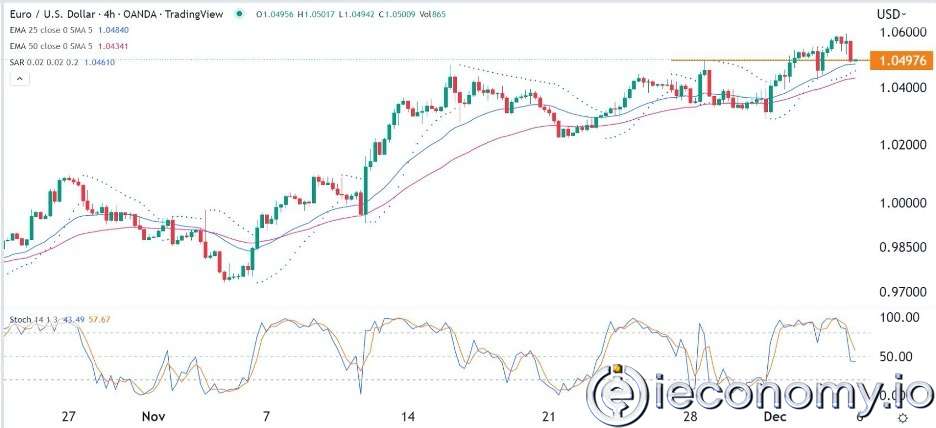
Forex Signal For EUR/USD: Starry US Data Points to Higher Fed Increases.
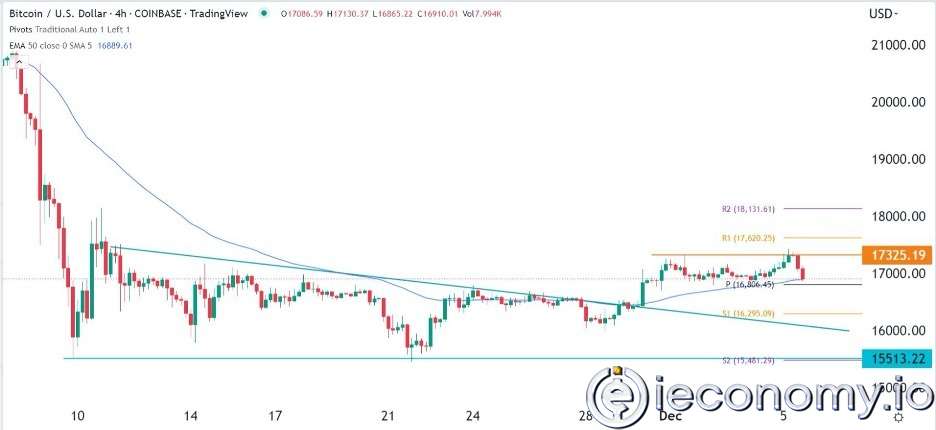
Forex Signal For BTC/USD: Downside Continues as Bitcoin Recovery Moves Less.
En Popüler Haberler
Yorum Yap
Yorumlar
Henüz yorum yapan yok! İlk yorumu siz yapın...