6469
0
GBP / USD Analysis
GBP / USD tests daily downtrend despite the bullish trend GBP / USD is trading around the 1.2725 of daily declines. However, the 4-hour chart on Friday draws a positive picture
Yazar: editor_1
Yayınlanma: 25 Temmuz 2020 00:42
Güncellenme: 29 Ocak 2026 17:49
GBP / USD Analysis
GBP / USD tests daily downtrend despite the bullish trend GBP / USD is trading around the 1.2725 of daily declines. However, the 4-hour chart on Friday draws a positive picture for bulls. Also, SMA and acceleration are in the positive part. “GBP / USD trades above the 50, 100, and 200 Simple Moving Average on the 4-hour chart, forming the highest and lowest level. Momentum has weakened a little but it moves up. " “Resistance is at 1.2773, the highest level of the day. After this level, 1.2815 level, which is the peak of June, is waiting. “Support is initially seen in 1.2715. This level is followed by the 1.2670 level. The next levels are 1.2645 and 1.2610. "İLGİLİ HABERLER


European stocks soared and focus shifted to German retail sales after Powell's speech!

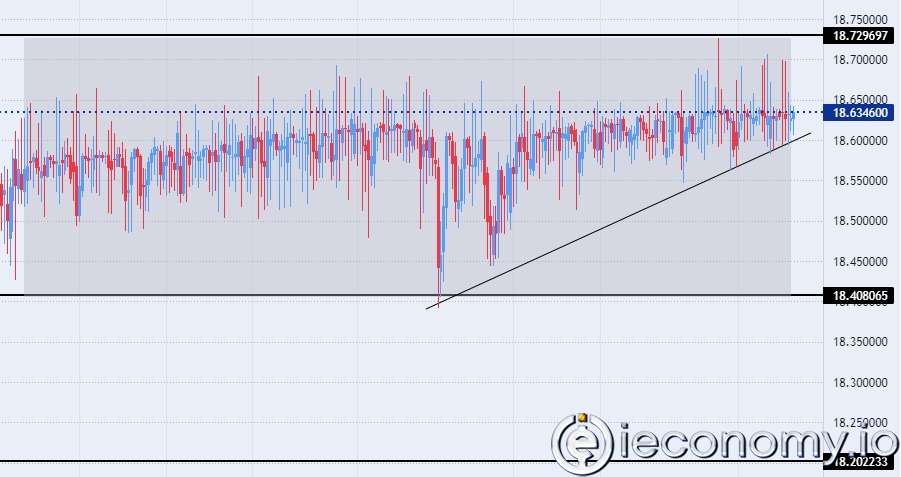
Forex Signal For TRY/USD: Inflation Slowdown in November.

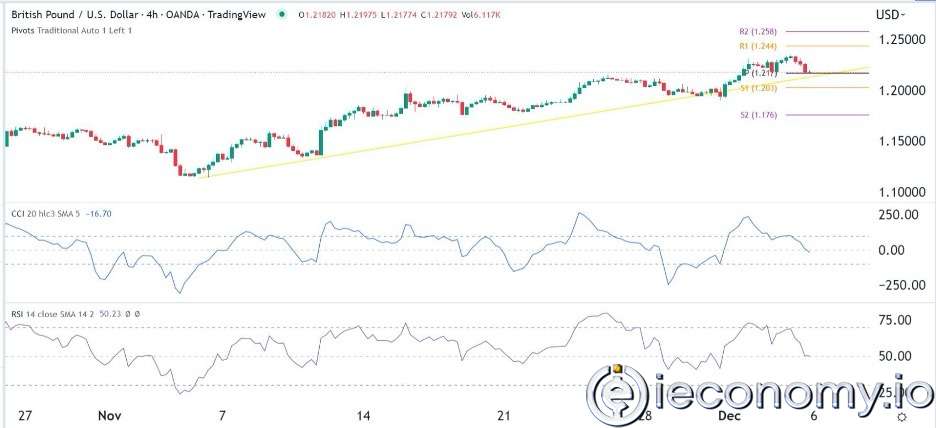
Forex Signal For GBP/USD: Bullish Trend Still Not Breaking While Recovery Continues.

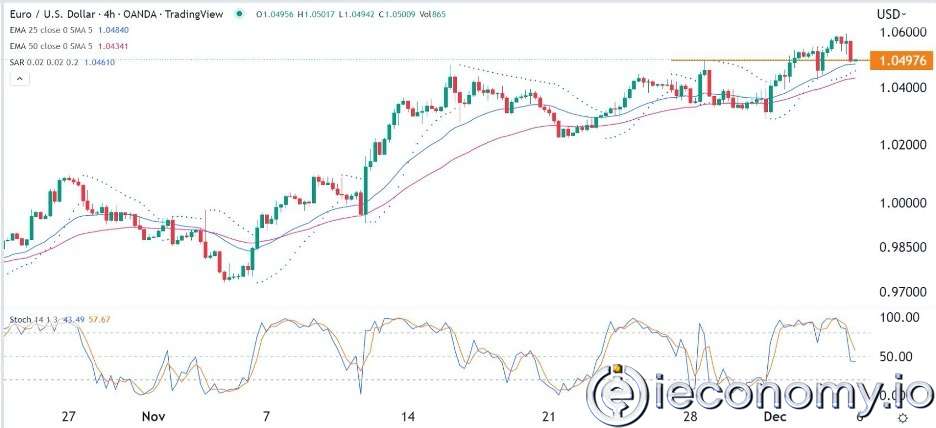
Forex Signal For EUR/USD: Starry US Data Points to Higher Fed Increases.

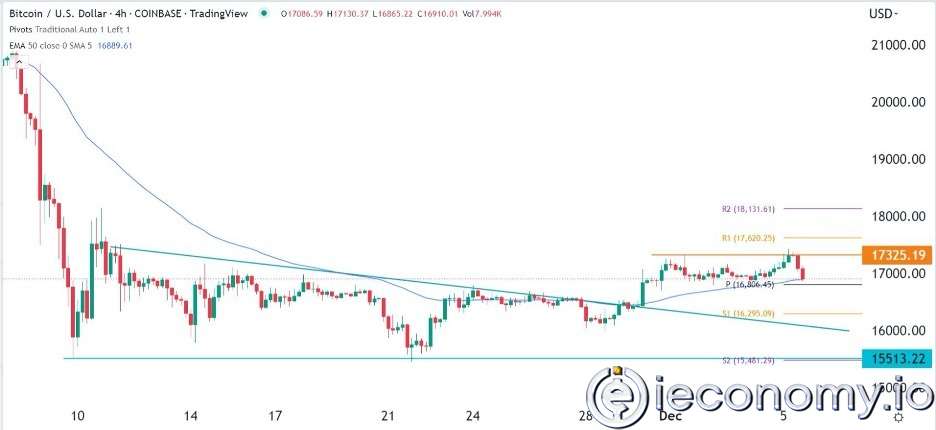
Forex Signal For BTC/USD: Downside Continues as Bitcoin Recovery Moves Less.
En Popüler Haberler
Yorum Yap
Yorumlar
Henüz yorum yapan yok! İlk yorumu siz yapın...