Markets By TradingView
10052
0

Gold Price Analysis: Downside appears more compelling while below $1946 – Confluence Detector

Gold Price Analysis: Downside appears more compelling while below $1946 – Confluence Detector; Gold Price Analysis: Downside appears more compelling while

Gold Price Analysis: Downside appears more compelling while below $1946 – Confluence Detector
Yazar: Zack Smith

Yayınlanma: 7 Eylül 2020 17:42

Güncellenme: 16 Mayıs 2024 18:32

Gold Price Analysis: Downside appears more compelling while below $1946 – Confluence Detector
Let’s take a look at how the yellow metal is positioned on the charts.   
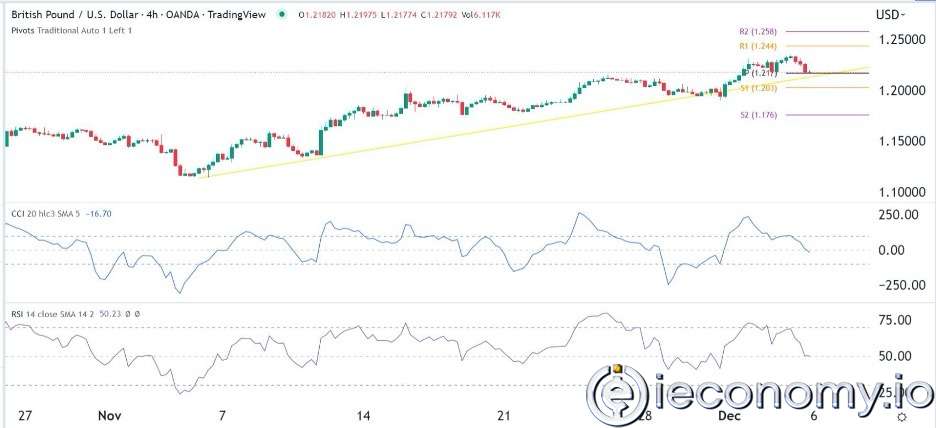
The recovery in Gold (XAU/USD) from Friday’s sell-off lost legs, as sellers returned on Monday amid resurgent demand for the US dollar across the board. Stronger US unemployment rate and wage growth data continue to lend support to the dollar bulls. Meanwhile, the sell-off in GBP/USD due to rising Brexit concerns, add to the buoyant tone around the greenback. Looking ahead, the dollar could likely hold its upbeat momentum amid light trading and tepid risk tone, which may keep the XAU sellers hopeful. Let’s take a look at how the yellow metal is positioned on the charts.

Gold: Key resistances and supports

The tool shows that gold faced rejection just below the critical barrier at $1946, which is the convergence of the Fibonacci 38.2% one-month and SMA10 one-day. Only a sustained break above the latter will save the day for the bulls, opening doors for a test of the next strong cap at $1950, where the previous day high, pivot point one-day R1 and SMA5 one-day coincide.  
The next powerful cushion awaits at $1916
  To the downside, immediate support is aligned at $1929, the confluence of the Fibonacci 61.8% one-day and Bollinger Band 15-minutes Lower. The next powerful cushion awaits at $1916, which could challenge the bears’ commitment. That level is the intersection of the previous day low and pivot point one-day S1. Meanwhile, acceptance below $1913, the Fibonacci 23.6% one-month, will expose the $1900 mark.  

About the Confluence Detector

With the TCI (Technical Confluences Indicator) tool, you can easily locate areas where the price can find a support zone or resistance zone and make trading decisions. If you are a short-term trader, you will find entry points for counter-trend strategies and hunt a few points each time. If you are a medium- and long-term trader, this tool will allow you to know in advance the price levels in which a medium / long-term trend can stop your travel and rest, where to undo positions or where to increase your position. You might also be interested in:
En Popüler Haberler

Yorum Yap

Yazılan yorumlar hiçbir şekilde Son Ekonomi Haberleri - Türkiye Dünya - ieconomy.io görüş ve düşüncelerini yansıtmamaktadır. Yorumlar, yazan kişiyi bağlayıcı niteliktedir.

Yorumlar

Henüz yorum yapan yok! İlk yorumu siz yapın...

Borsa, Kripto, Hisse, Emtia ve Döviz Haberleri

ieconomy: Türkiye'nin en kapsamlı ekonomi haber sitesi. Son dakika haberleri ve en güncel haberler ieconomy'da.