11142
0
How to Read Cryptocurrency Charts?
As crypto assets continue to be followed with interest all over the world, investors often use charts to open and close positions...

Yazar: James Gordon
Yayınlanma: 22 Temmuz 2022 00:47
Güncellenme: 18 Şubat 2026 02:17
How to Read Cryptocurrency Charts?
As crypto assets continue to be followed with interest all over the world, investors often use charts to open and close positions in the assets they are interested in. While small-scale investors showed interest in this market at first, recently, large companies, statesmen and even governments have been involved in the system. To trade and invest in the cryptocurrency market, you will need to analyze the market. We have compiled all the curious details such as crypto chart reading, candlestick chart reading, Binance chart reading and chart reading on the stock exchange.
It is important to interpret the charts correctly in order to make technical analysis in the cryptocurrency market, which is followed with interest all over the world. Technical analysis is needed in the entire financial sector and news, the latest developments in the sector, the latest developments in the financial field are part of fundamental analysis. Market charts are unique auxiliary data that hide many clues for a good trader. Therefore, reading these charts correctly, which are drawn over various time periods, will play a big role in the decisions that the investor will make.
How to read a coin chart:
What is support and resistance?
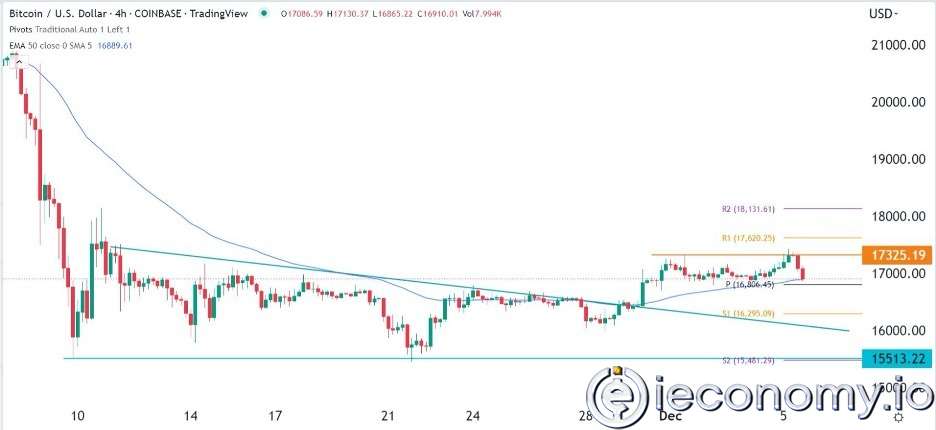
When the price reaches a level that cannot be exceeded and acts as a kind of barrier to that level. In the case of support, the price reaches a "floor" and in the case of resistance, a "ceiling". Support = demand zone, resistance = supply zone. Resistance is the level at which an uptrend in the price of a cryptoasset ends with increased selling and profit-taking. Selling pressure is created by "bears" aiming for the price to fall or traders looking to take profits at the current level. Heavy selling at the top leads to the formation of a resistance line. Although support and resistance are generally shown as lines, they do not have precise lines. Another thing to keep in mind is that markets have no mechanism to avoid crossing a certain level. Since cryptocurrency traders and traders will encounter the same levels, there may be an increase in liquidity in these areas. It's easy to enter or exit support and resistance points, especially for whales that trade large volumes.What is a Trendline?
In the technical analysis of the price of any financial asset, the line formed over successive support or resistance values is called a trendline. Resistance levels start to form when the market is in an uptrend. The main element used for the trend line is the market's historical data. The strength of each support or resistance level and the trend line formed by them increases as they repeat over time. In other words, if the same price has worked as resistance or support multiple times, the strength and accuracy of the trend line that crosses it will increase.You may also be interested in this: What Are Candlestick Patterns Used in Technical Analysis? A candlestick chart is a chart that shows a specific period of time. Candlestick charts are created by taking into account the opening and closing prices of a financial asset's low and high. What are bullish candlestick patterns, stock market candlestick patterns used in the markets? https://ieconomy.io/teknik-analizlerde-kullanilan-mum-grafik-formasyonlari-nelerdir/ The investment information, comments and recommendations contained herein are not investment advice. Investment advisory services are provided individually, taking into account the risk and return preferences of individuals. The content, comments and recommendations contained herein, which are in no way directive in nature, are of a general nature. These recommendations may not be suitable for your financial situation and risk and return preferences. Therefore, making an investment decision based solely on the information contained herein may not produce results in line with your expectations.
İLGİLİ HABERLER

European stocks soared and focus shifted to German retail sales after Powell's speech!

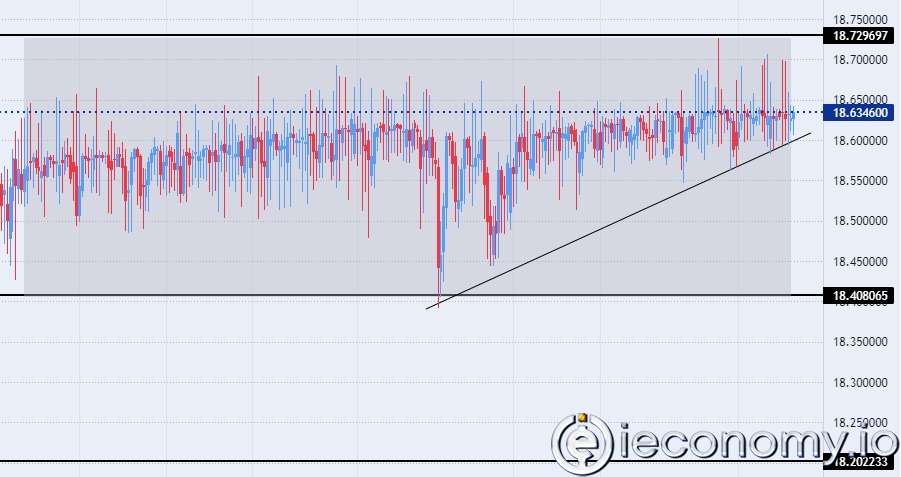
Forex Signal For TRY/USD: Inflation Slowdown in November.

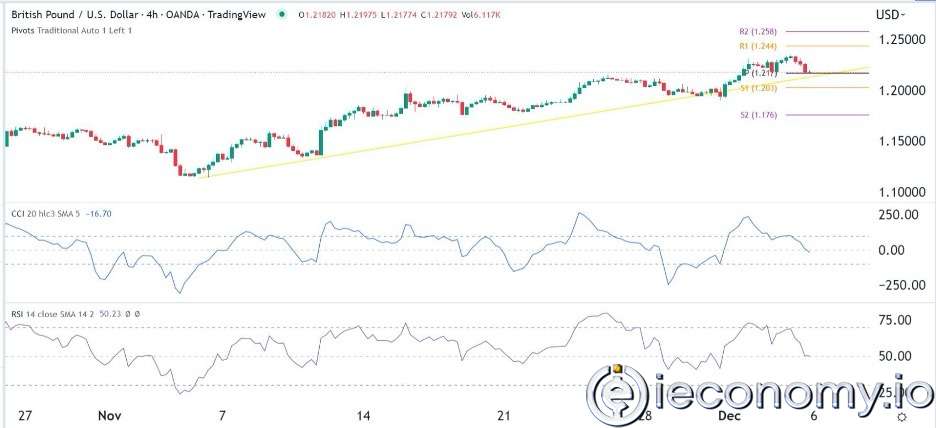
Forex Signal For GBP/USD: Bullish Trend Still Not Breaking While Recovery Continues.

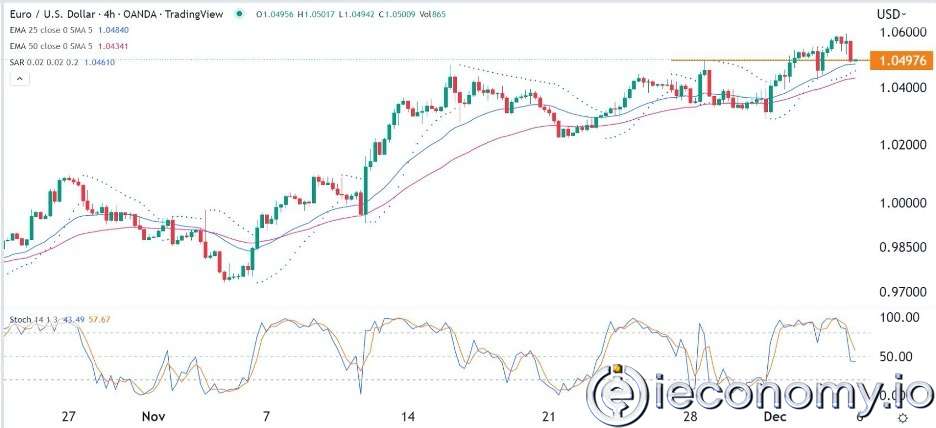
Forex Signal For EUR/USD: Starry US Data Points to Higher Fed Increases.

Forex Signal For BTC/USD: Downside Continues as Bitcoin Recovery Moves Less.
En Popüler Haberler
Yorum Yap
Yorumlar
Henüz yorum yapan yok! İlk yorumu siz yapın...