5695
0
Indicators Are Pointing To A Decline in Bitcoin
Indicators are pointing to a decline in Bitcoin. The creator of the Pi Cycle Top indicator expects a bigger drop.
07.06.2021 14:13|ieconomy - Haber Merkezi
Yazar: Eylem Özer
Yayınlanma: 7 Haziran 2021 14:13
Güncellenme: 4 Temmuz 2026 01:40
Indicators Are Pointing To A Decline in Bitcoin
Indicators are pointing to a decline in Bitcoin. The creator of the Pi Cycle Top indicator expects a bigger drop.
Philip Swift, the creator of the Pi Cycle Top indicator, which peaked in Bitcoin, the leading unit of the cryptocurrency market, in 2013, 2014, 2017 and 2021, said in his latest statement that he expects a deeper decline in Bitcoin. This time, Philip Swift chose to use a modified version of the 200-week moving average heatmap originally from analyst Plan B."We're Going Back To Blue..."
Stating that the last point is painted on the 200-week moving average heat map, Swift said, "We are going back to blue for now..." Looking at the chart, it is observed that after the green, yellow and red dots in 2014 and 2017, the price started to cool down from the first turquoise point and continued to cool down to the 200-week average. On the chart, this level crosses the $8,000 levels, which is said to be the bottom of a possible bear market. The basic information about the indicator is explained as follows: “In each of the major market cycles, the Bitcoin price bottoms out when it approaches the 200-week moving average. This indicator uses a color heatmap based on the percentage increase of the 200-week moving average. A color is assigned to the price chart based on the % month-to-month increase of the 200-week moving average. Historically, it can be considered a good time to sell Bitcoin when the market is overheating when we see the orange and red dots assigned to the price chart. Periods when price points are purple and close to the 200-week MA have historically been good times to buy.” When the movements in 2014 and 2017 are analyzed, it is observed that after the first turquoise dot, the transition to the purple and dark blue regions did not go directly, and the decline continued after the price increased a little and a green dot was burned.The Price Has Shifted From Overheating To Cooling Down
Although Philip Swift says that this chart points to deeper declines, there is another factor that stands out. In this bull cycle, if the peak is at $64,000, it can be said that the price has moved from overheating to cooling. So much so that in 2021, unlike 2014 and 2017, we see that the price begins to decrease without any orange or red dots.This content does not constitute investment advice.
İLGİLİ HABERLER
European stocks soared and focus shifted to German retail sales after Powell's speech!
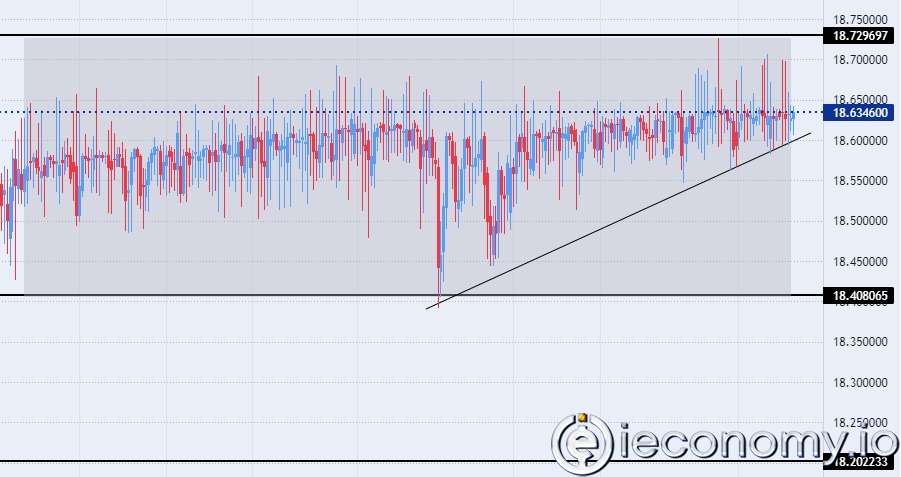
Forex Signal For TRY/USD: Inflation Slowdown in November.
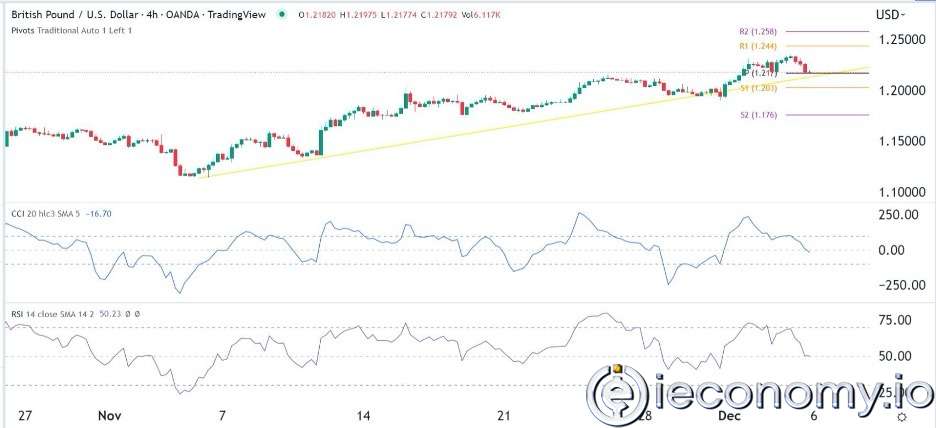
Forex Signal For GBP/USD: Bullish Trend Still Not Breaking While Recovery Continues.
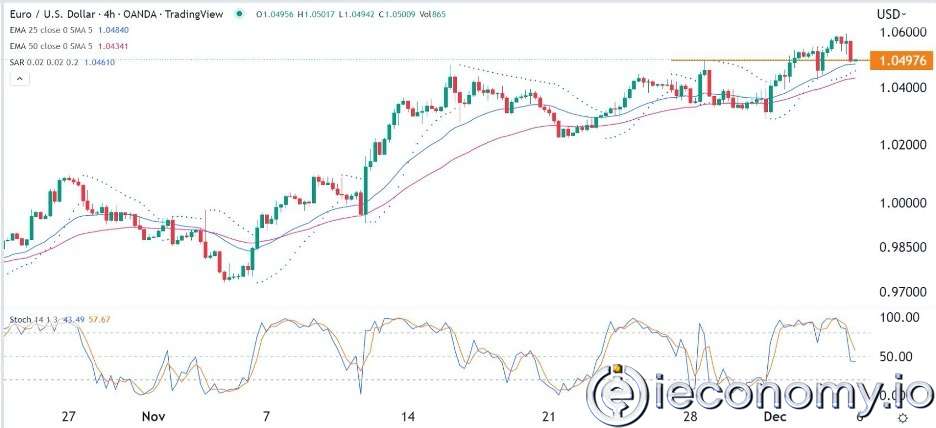
Forex Signal For EUR/USD: Starry US Data Points to Higher Fed Increases.
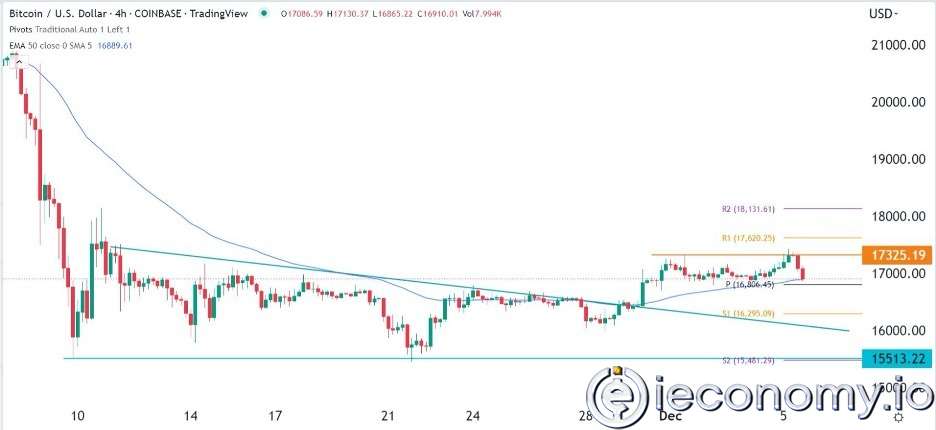
Forex Signal For BTC/USD: Downside Continues as Bitcoin Recovery Moves Less.
En Popüler Haberler
Yorum Yap
Yorumlar
Henüz yorum yapan yok! İlk yorumu siz yapın...