7143
0
Silver Price Analysis
- The hourly RSI is trading above 50.00, which supports the bullish trend.

Yazar: editor_1
Yayınlanma: 4 Ağustos 2020 16:45
Güncellenme: 5 Şubat 2026 00:54
Silver Price Analysis
- The hourly RSI is trading above 50.00, which supports the bullish trend. Silver (XAG / USD) was on the verge of breaking after being consolidated over $ 24 in a symmetrical triangle formation on the one-hour chart. The falling trendline resistance will open a gate to test the top target at $ 25.57, confirming a break pattern above $ 24.37. It can test the psychological resistance of $ 24.50 ahead of this level. The next hurdle comes across as $ 24.95, the highest intersection of July 29 and August 3. The Hourly Relative Strength Index (RSI) supports upwards, remaining steady above the midline. On the downside, the $ 24.28 level offers strong support, which is the convergence of rising trendline support 21 and 50-HMAs. Sales pressure will intensify with a break below the other, leading to testing the horizontal 100-HMA at $ 24.06. The next band is close to $ 23.80.
İLGİLİ HABERLER

European stocks soared and focus shifted to German retail sales after Powell's speech!

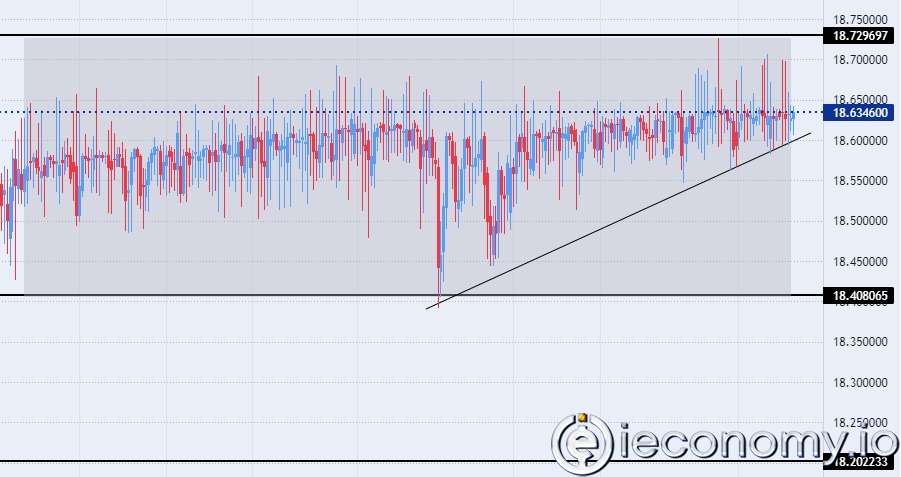
Forex Signal For TRY/USD: Inflation Slowdown in November.

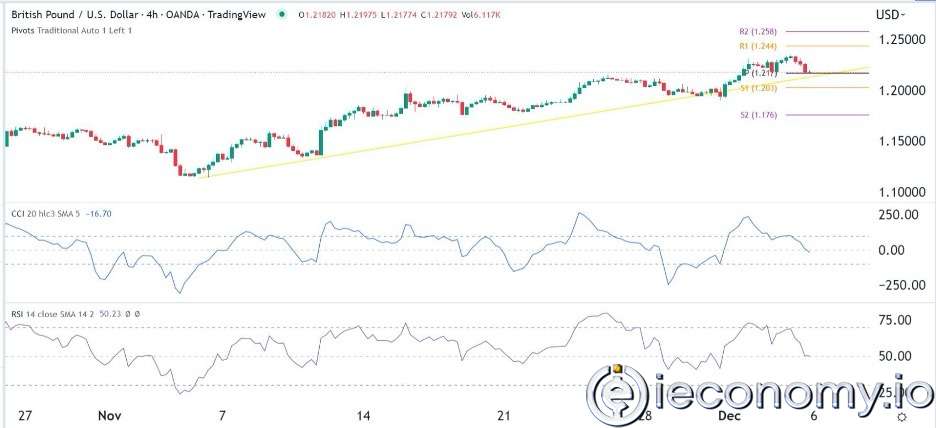
Forex Signal For GBP/USD: Bullish Trend Still Not Breaking While Recovery Continues.

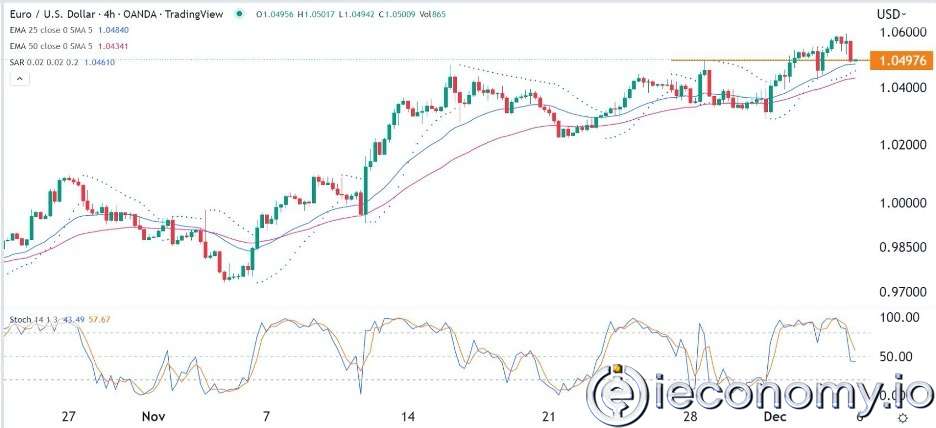
Forex Signal For EUR/USD: Starry US Data Points to Higher Fed Increases.

Forex Signal For BTC/USD: Downside Continues as Bitcoin Recovery Moves Less.
En Popüler Haberler
Yorum Yap
Yorumlar
Henüz yorum yapan yok! İlk yorumu siz yapın...