11649
0
What is Support and Resistance?
Support and resistance are the most frequently heard concepts in the forex market, as well as technical analysis concepts used in all financial markets.

Yazar: Gülşah Aksoy
Yayınlanma: 8 Temmuz 2020 20:03
Güncellenme: 2 Şubat 2026 10:18
What is Support and Resistance?
Support and resistance are the most frequently heard concepts in the forex market, as well as technical analysis concepts used in all financial markets. The concept of resistance can be defined as the last point of the rise in prices. After this point, prices begin to decrease. Support can be described as the opposite. It is the last point that the decline in prices reached before going up again. The above chart shows an upturn of the zigzag model. As can be seen here, the highest level of resistance that prices have reached before falling is called support, while the lowest level that has reached before rising is called support.
Support and resistance continue to occur as prices move up and down constantly.
In other words, the place where buyers come to the market is support and the place where sellers come to the market is resistance. Because the price reaches the support level, it drives the investors to make purchases. When the prices rise to the resistance level, investors believe that they should sell.
In general, the operations performed at the support and resistance levels are basically the following:
Splash trading
- Purchases are made when the price drops to the support level.
- Sales are made when the price rises to the resistance level.
Break trading
- Purchase is made when the price breaks through resistance.
- Sales are made when the price is broken through support.
Drawing Support and Resistance Levels
First of all, it should be remembered that the levels of support and resistance are not exact figures. When you look at the graphics, you can see a level of support and resistance that looks broken. These breaks are very important movements. Because the parities show only two forms of behavior here. The pair reaching the support or resistance level; either quickly returns as described above, or passes this level and continues on its way quickly. The movement of the parities passing this level is generally referred to as breaking. It is very important to estimate these movements while making a transaction. Let's look at how the levels of support and resistance are expressed in the graphics. Support and resistance levels are often represented in the charts by candlestick shadows. The support level in the chart above is around 1.20. The EUR / CHF parity is having difficulty getting below this level.
 The graphic above shows a resistance level of around 1.29.
How to Understand Whether Support and Resistance Is Broken?
There is no definitive answer to this question. Whether the support or resistance levels are broken only becomes clear when closing above or below these levels. It should not be forgotten that if the support or resistance breaks, these levels will change places, the broken support will turn into resistance, and the broken resistance will turn into support. The graphic above shows how support and resistance levels are displaced.
 Again in the chart above, we can see how the levels of support and resistance have changed over time.
Other things to know about support and resistance:
- The longer the prices stop at the support and resistance levels (the longer the trading time), the more it will be valid and the more robust it will be.
- Thinking support and resistance as "regions" rather than concrete numbers will help you more.
- Long term graphics are always more reliable. That is, the support and resistance levels on a weekly chart will be much more robust than the 15-minute chart.
- There may be some question marks in your mind. But don't let this mislead you. By doing a little practice, you can easily predict potential support and resistance levels.
İLGİLİ HABERLER


European stocks soared and focus shifted to German retail sales after Powell's speech!

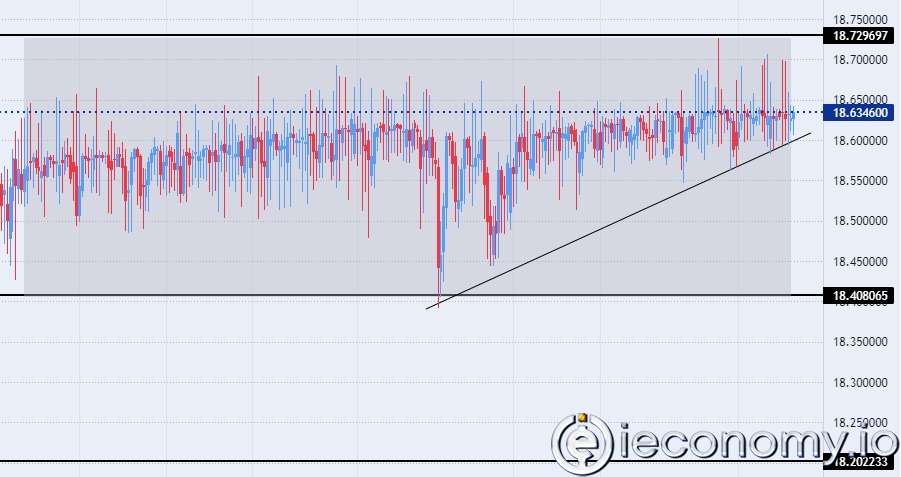
Forex Signal For TRY/USD: Inflation Slowdown in November.

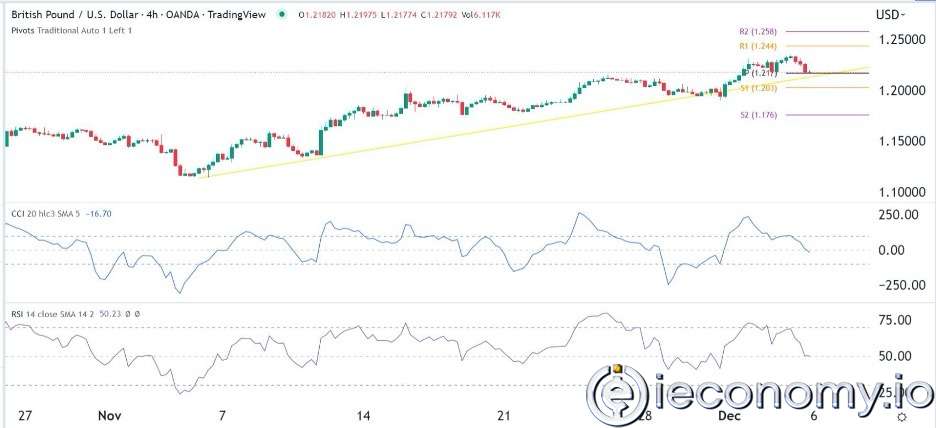
Forex Signal For GBP/USD: Bullish Trend Still Not Breaking While Recovery Continues.

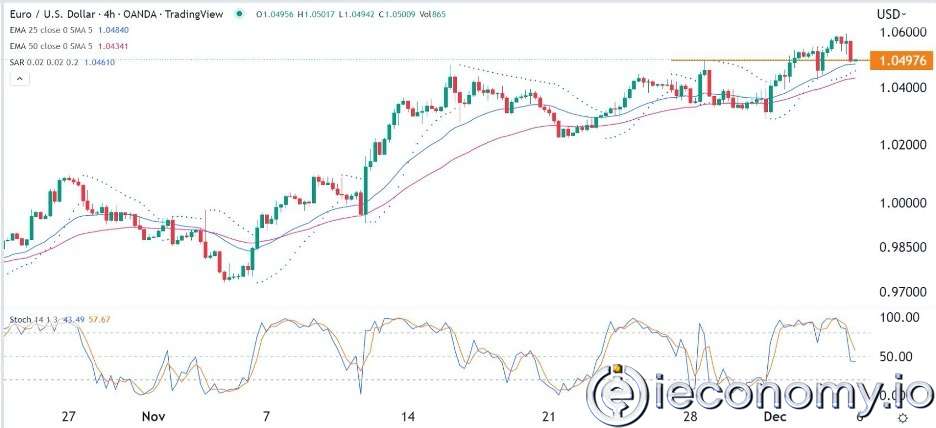
Forex Signal For EUR/USD: Starry US Data Points to Higher Fed Increases.

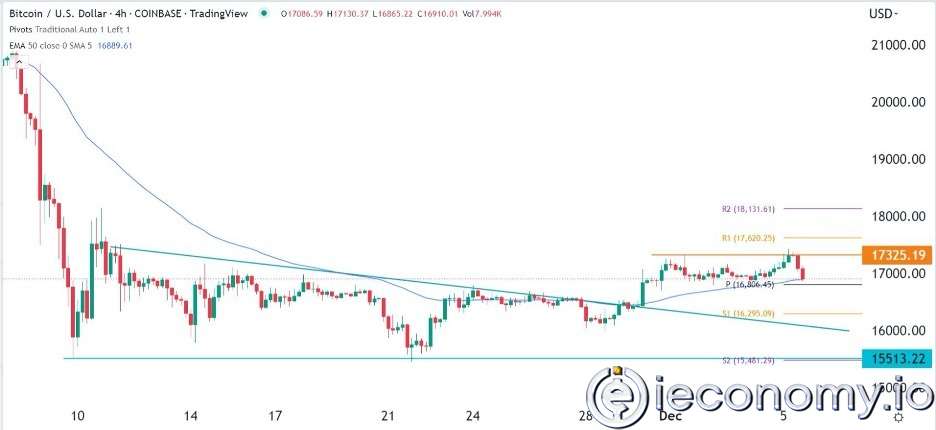
Forex Signal For BTC/USD: Downside Continues as Bitcoin Recovery Moves Less.
En Popüler Haberler
Yorum Yap
Yorumlar
Henüz yorum yapan yok! İlk yorumu siz yapın...