10663
0
Bitcoin Gave A Bullish Signal After 73 Days
Bitcoin gave a bullish signal after 73 days. Leading crypto Bitcoin has been hovering below $45,000 for 73 days.
Yazar: Eylem Özer
Yayınlanma: 29 Mart 2022 01:38
Güncellenme: 13 Nisan 2026 13:50
Bitcoin Gave A Bullish Signal After 73 Days
Bitcoin gave a bullish signal after 73 days. Leading crypto Bitcoin has been hovering below $45,000 for 73 days.
Cryptocurrency market total volume has been on the decline for 3 months. With its leap as of Sunday, March 27, 2022, it broke this falling trend and closed the week with an increase of around 15 percent. At the same time, it reached to $ 2.1 trillion, after surpassing the resistance of $ 2 trillion. This increase in volume almost created a gasoline effect in the market. In particular, Bitcoin and then Ethereum, Binance Coin, Solana, Dogecoin, which can be described as major cryptocurrencies, rose by 13 to 25 percent in the CoinMarketCap ranking. In the past three months, many fundamental factors such as the war between Russia and Ukraine, inflation, interest rate expectations, and Covid-19 have negatively affected the cryptocurrency market. These uncertainties and negativities we mentioned took the value of Bitcoin from $ 69,000 to $ 33,000 over time. With the last jump, this downtrend was broken. And according to data from Glassnode, 81.8% of the total supply of Bitcoin and 86.4% of the total supply of Ethereum has now started to profit. From this point of view, the market promises hope to investors who are at a loss, while giving the green light to new investors. In the market where such sharp rises are seen, investors tend to look for an opportunity in Bitcoin first and then opportunities in other altcoins. Therefore, while the increase in the general volume goes to Bitcoin, the new volume and some of the volume in Bitcoin pass to altcoins. We see the same example of this in the market right now. Altcoin investors are anticipating this volume transition.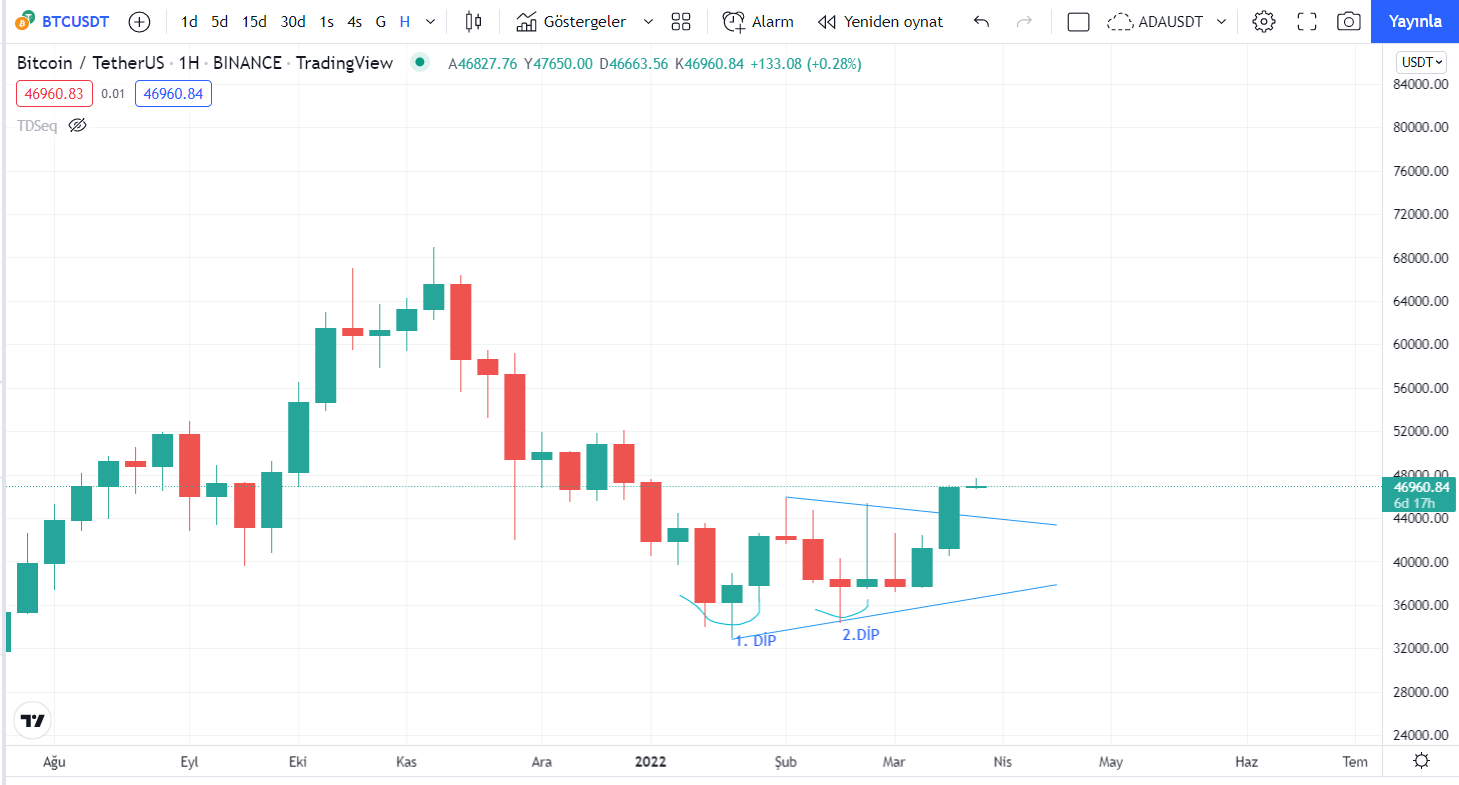 When we examine Bitcoin's weekly chart, we see a double bottom formation. The first target of double bottom formations is where the breakout begins. Apart from this, there is a pennant formation. We've seen it come out of this pennant last week. Both are giving positive bullish signals. The permanence of this rise, which may turn into an ascending channel formation in the coming weeks, is very important. Since there has been a very sharp rise, the possibility of a correction to balance the buying and selling seems strong.
Bitcoin Value: $46,890
Critical Resistance Level: $48,221/50,000/51,967
Critical Support $45,000/41,470/$39,500
RSI (14) signals neutral at 68.88, while MACD (12.26) signals buy at 1469.08. Similarly, out of 11 oscillators, including momentum and stochastics, 7 are neutral, three are sell and the remaining one is buy.
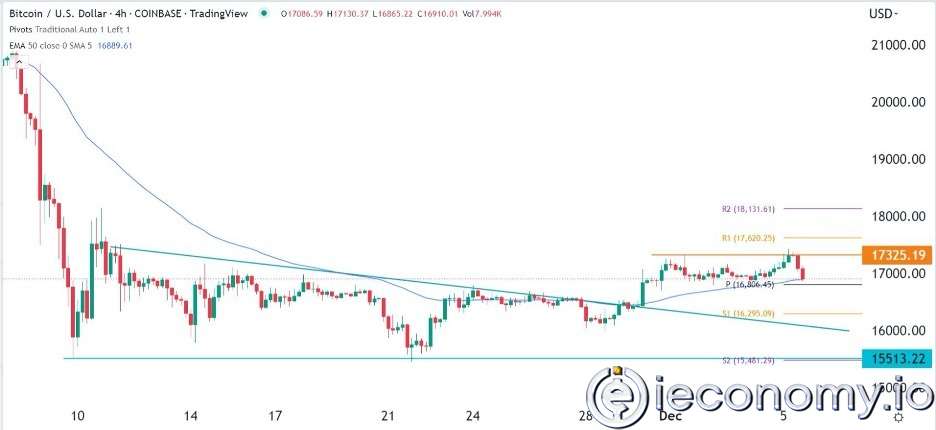
When we examine Bitcoin's weekly chart, we see a double bottom formation. The first target of double bottom formations is where the breakout begins. Apart from this, there is a pennant formation. We've seen it come out of this pennant last week. Both are giving positive bullish signals. The permanence of this rise, which may turn into an ascending channel formation in the coming weeks, is very important. Since there has been a very sharp rise, the possibility of a correction to balance the buying and selling seems strong.
Bitcoin Value: $46,890
Critical Resistance Level: $48,221/50,000/51,967
Critical Support $45,000/41,470/$39,500
RSI (14) signals neutral at 68.88, while MACD (12.26) signals buy at 1469.08. Similarly, out of 11 oscillators, including momentum and stochastics, 7 are neutral, three are sell and the remaining one is buy.İLGİLİ HABERLER
European stocks soared and focus shifted to German retail sales after Powell's speech!
Forex Signal For TRY/USD: Inflation Slowdown in November.
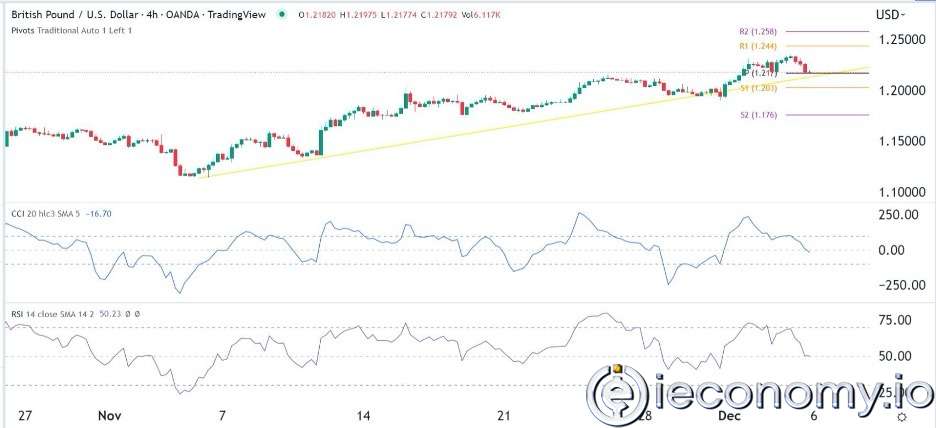
Forex Signal For GBP/USD: Bullish Trend Still Not Breaking While Recovery Continues.
Forex Signal For EUR/USD: Starry US Data Points to Higher Fed Increases.
Forex Signal For BTC/USD: Downside Continues as Bitcoin Recovery Moves Less.
En Popüler Haberler
Yorum Yap
Yorumlar
Henüz yorum yapan yok! İlk yorumu siz yapın...