10338
0
Is Bitcoin Far From Its True Value?
Is Bitcoin far from its true value? How much should Bitcoin actually be? The famous analyst revealed the true value of Bitcoin.
Yazar: Eylem Özer
Yayınlanma: 18 Haziran 2021 14:55
Güncellenme: 4 Şubat 2026 20:03
Is Bitcoin Far From Its True Value?
Is Bitcoin far from its true value? How much should Bitcoin actually be? The famous analyst revealed the true value of Bitcoin.
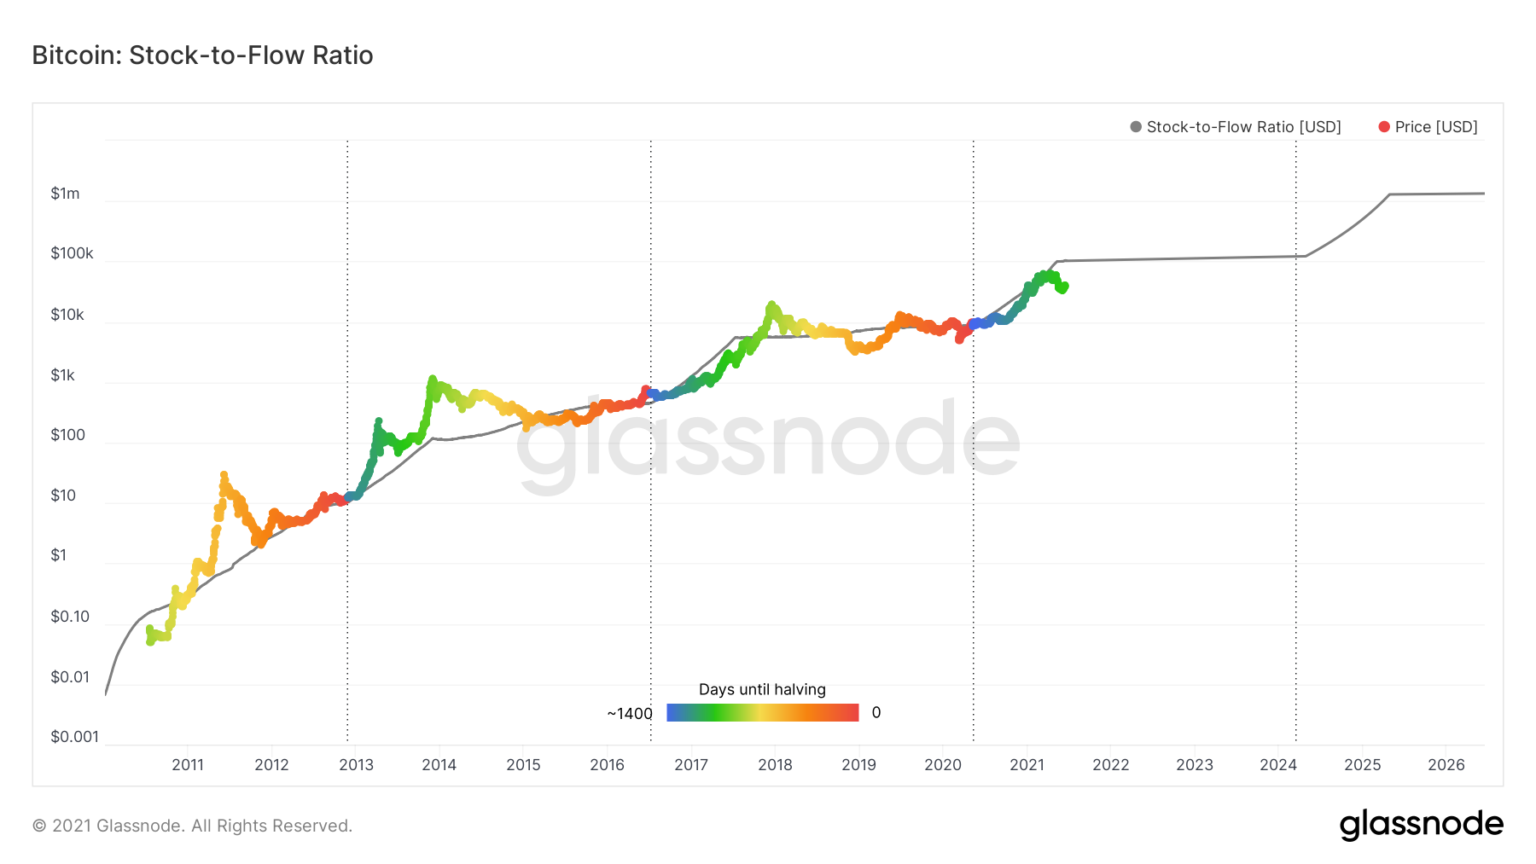
According to the stock-to-flow chart, Bitcoin has never been this far from its true value since its inception. Something similar happened in the middle of the bull market in 2017. Afterwards, BTC price continued its parabolic rise. It seems that Bitcoin has deviated from the 11-year uptrend line. Now this deviation stands in negative territory with 36 percent. This metric, along with a new signal proving that Bitcoin is below its true value, reveals that the upward price action will continue to much higher levels. As a matter of fact, the peaks of previous bull markets have also carried the leading cryptocurrency above this trend line.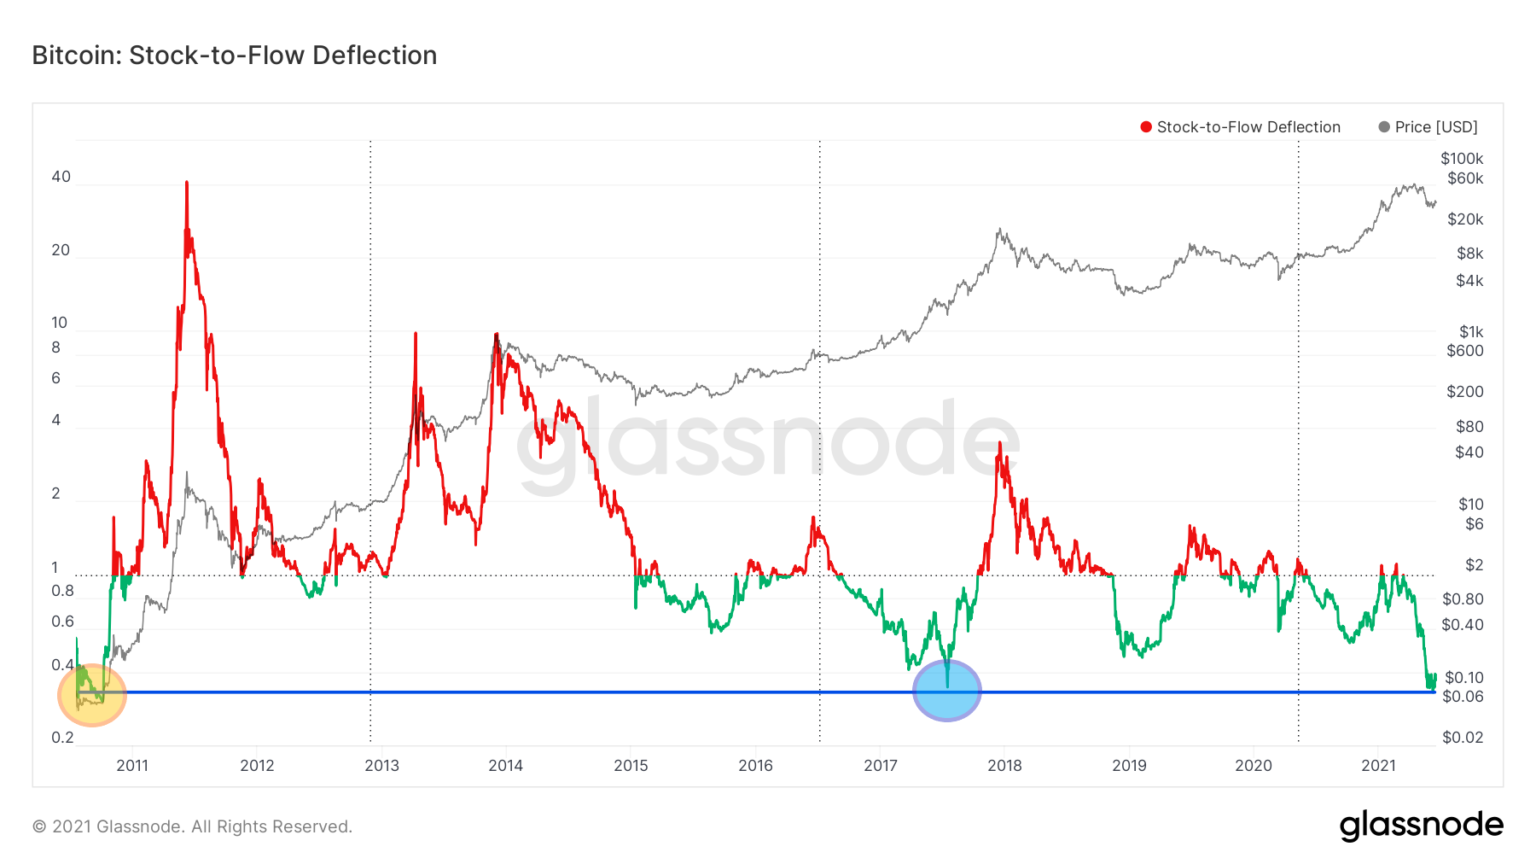 What Does the Famous Analyst Say?
Renowned cryptocurrency analyst @CryptoMichNL stated that Bitcoin's price divergence chart relative to the stock-to-flow model is at its lowest level in the last 10 years.
Bitcoin, which is currently around $ 40,000, should have been over $ 100,000 according to the model. The last time such a large negative divergence occurred was in October 2010. At that time, the Bitcoin price was lower than $0.1. (yellow circle).
[caption id="" align="alignnone" width="1536"]
 Stock Flow Model Source: Glassnode[/caption]
On the other hand, the chart points to another story where the divergence almost touches the current levels (blue circle). This happened in the middle of the previous bull market, namely in July 2017.
In the aforementioned period, while BTC traded for about $ 2,000, its price increased exponentially after a few months. This increase continued until it reached an all-time high of $20,000 in December 2017.
Accordingly, the stock-to-flow bias chart doesn't just paint an overall picture of the relative value of BTC. It also provides an additional argument that we are in the middle of a long-term bull market. At the same time, this argument aligns with a number of on-chain analysis indicators currently giving similar signals.
On the other hand, yesterday, the CEO of Pantera Capital shared a chart on Twitter showing the Bitcoin price deviating from its 11-year trend. This divergence proves that the current price is 36 percent below the trendline. Also, the chart shows that the largest cryptocurrency spends only 20.3 percent of all time, below 0 percent.
https://twitter.com/dan_pantera/status/1405566148905553920?ref_src=twsrc%5Etfw%7Ctwcamp%5Etweetembed%7Ctwterm%5E1405566148905553920%7Ctwgr%5E%7Ctwcon%5Es1_&ref_url=https%3A%2F%2Fkoinmedya.com%2Funlu-analist-gercek-bitcoin-degerini-acikladi%2F
Meanwhile, the -36 percent level indicates that the price of the asset is much lower than it should be, as it appears several times in the current cycle. Besides, in its calmer cycle of 2015-2017 BTC never dropped to this point.
To conclude, this reinforces the notion that Bitcoin's movements in the current cycle are more similar to those in 2012-2013 than in the 2015-2017 bull market.
Stock Flow Model Source: Glassnode[/caption]
On the other hand, the chart points to another story where the divergence almost touches the current levels (blue circle). This happened in the middle of the previous bull market, namely in July 2017.
In the aforementioned period, while BTC traded for about $ 2,000, its price increased exponentially after a few months. This increase continued until it reached an all-time high of $20,000 in December 2017.
Accordingly, the stock-to-flow bias chart doesn't just paint an overall picture of the relative value of BTC. It also provides an additional argument that we are in the middle of a long-term bull market. At the same time, this argument aligns with a number of on-chain analysis indicators currently giving similar signals.
On the other hand, yesterday, the CEO of Pantera Capital shared a chart on Twitter showing the Bitcoin price deviating from its 11-year trend. This divergence proves that the current price is 36 percent below the trendline. Also, the chart shows that the largest cryptocurrency spends only 20.3 percent of all time, below 0 percent.
https://twitter.com/dan_pantera/status/1405566148905553920?ref_src=twsrc%5Etfw%7Ctwcamp%5Etweetembed%7Ctwterm%5E1405566148905553920%7Ctwgr%5E%7Ctwcon%5Es1_&ref_url=https%3A%2F%2Fkoinmedya.com%2Funlu-analist-gercek-bitcoin-degerini-acikladi%2F
Meanwhile, the -36 percent level indicates that the price of the asset is much lower than it should be, as it appears several times in the current cycle. Besides, in its calmer cycle of 2015-2017 BTC never dropped to this point.
To conclude, this reinforces the notion that Bitcoin's movements in the current cycle are more similar to those in 2012-2013 than in the 2015-2017 bull market.İLGİLİ HABERLER

European stocks soared and focus shifted to German retail sales after Powell's speech!

Forex Signal For TRY/USD: Inflation Slowdown in November.

Forex Signal For GBP/USD: Bullish Trend Still Not Breaking While Recovery Continues.

Forex Signal For EUR/USD: Starry US Data Points to Higher Fed Increases.

Forex Signal For BTC/USD: Downside Continues as Bitcoin Recovery Moves Less.
En Popüler Haberler
Yorum Yap
Yorumlar
Henüz yorum yapan yok! İlk yorumu siz yapın...