10830
0
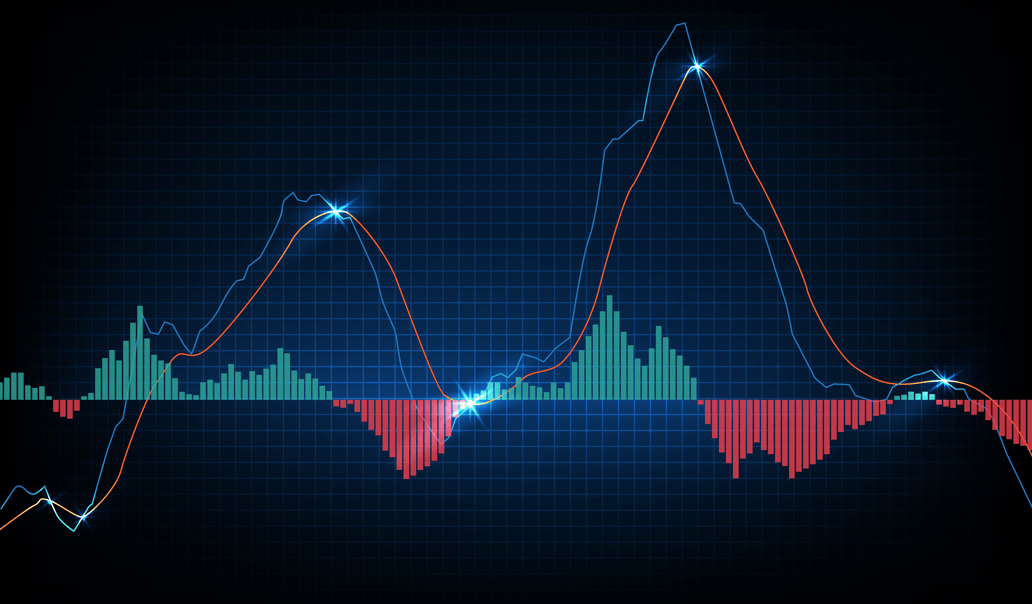
Technical Analysis What is MACD and How to Interpret it?
MACD, one of the most frequently used technical analysis indicators, stands for Moving Average Convergence Divergence.
03.07.2022 14:41|ieconomy - Haber Merkezi
Yazar: Charles Porter
Yayınlanma: 3 Temmuz 2022 14:41
Güncellenme: 14 Temmuz 2026 01:05
Technical Analysis What is MACD and How to Interpret it?
What is MACD?
MACD, one of the most frequently used technical analysis indicators, stands for Moving Average Convergence Divergence.
Before we move on to the use of MACD, let's get to know the concepts in this indicator:
Short and long-term exponential average: It is an exponential average, which is one of the moving average types. The short term is 12 days and the long term is 26 days, but the trader can change these maturities. In these two exponential moving averages, the short term is subtracted from the long term, i.e. 12-26. Subtracting the short term exponential average from the long term exponential average results in a single chart line. This is monitored as the MACD line. Signal: Apart from the MACD line formed by the difference between the short-term and long-term exponential average, the 9-day moving exponential average is also used, which is a separate line. The reason for using the 9-day exponential moving average is to better track the trend change together with the MACD. Histogram: It is an indicator used more as a column that shows the change and difference between the MACD and the signal. If the difference between the MACD and the signal is widened, that is, if the two lines move away from each other, the Histogram columns rise, if the difference between the MACD and the signal line decreases and the two lines approach each other, the Histogram columns narrow. An increase in the Histogram columns indicates that the price continues to move in the same direction, while a decrease in the Histogram columns indicates that the prices are stuck close to each other and the direction, i.e. the trend change, is approaching.Let's look at what the changes of the concepts we recognize on the chart mean:
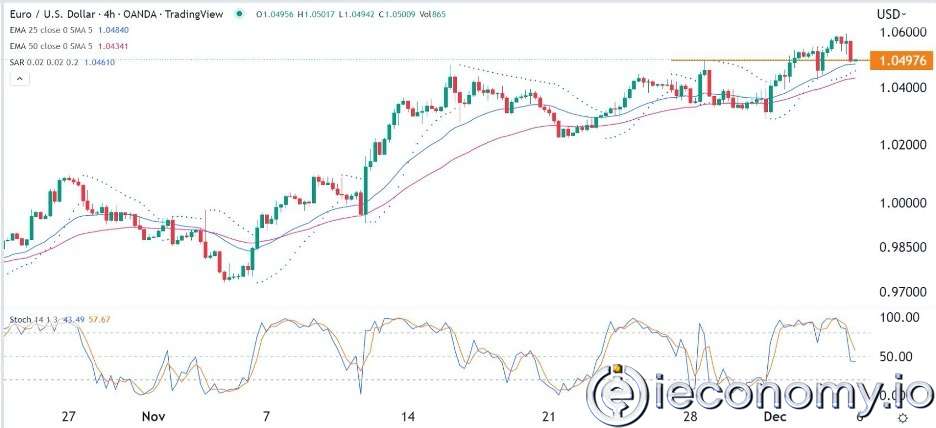
The widening of the difference between the short-term and long-term exponential moving averages indicates that the change in prices is high, and as the difference widens, the MACD indicator also shows volatility. Accordingly, if; The short-term moving exponential average (12) is above the long-term exponential moving average (26), the MACD is in positive territory, meaning it is rising. If the last 12-day exponential moving average is higher than the 26-day exponential moving average, the price is up, otherwise the price is down. If the short-term moving exponential average (12) is below the long-term exponential moving average (26), the MACD is in negative territory, i.e. falling. If the short-term moving exponential average (12) and the long-term exponential moving average (26) are equal, the MACD is in the zero (0) zone, i.e. horizontal. If the movement above the zero (0) zone continues, it means that the uptrend will continue, and if the movement below the zero (0) zone continues, it means that the downtrend will continue. The MACD indicator does not have overbought or oversold zones like the RSI, so to confirm overbought or oversold price, watch for the moment when the signal and the MACD start to converge and their crossing strengthens the possibility of a change in direction. Another point to watch between the signal line and the MACD is that if the MACD line is above the signal line, it means that the uptrend will continue, if the MACD line is below the signal line, it means that the downtrend will continue, while the horizontal and very close area warns that a change in direction will occur soon, either up or down. On the EURUSD chart, the MACD line is below the signal line, but the MACD line seems to be preparing for a reversal, with the intersection between the signal and the MACD, the directional change movement will begin. The 14-day RSI added to the chart gives a bullish signal from the oversold zone. However, when we use the two indicators together, the signal on the RSI side is more prominent while the MACD is still in the bearish zone in the short term. For this reason, it will be much healthier to follow the intersection with the signal. *We recommend using RSI and Moving Average or trend line together with the MACD indicator to follow the change in prices more reliably. Source: investing.comİLGİLİ HABERLER
European stocks soared and focus shifted to German retail sales after Powell's speech!
Forex Signal For TRY/USD: Inflation Slowdown in November.
Forex Signal For GBP/USD: Bullish Trend Still Not Breaking While Recovery Continues.
Forex Signal For EUR/USD: Starry US Data Points to Higher Fed Increases.
Forex Signal For BTC/USD: Downside Continues as Bitcoin Recovery Moves Less.
En Popüler Haberler
Yorum Yap
Yorumlar
Henüz yorum yapan yok! İlk yorumu siz yapın...