7232
0
What is a Double Top Pattern?
What does the double top pattern, which is one of the easy to analyze technical patterns frequently preferred by traders in cryptocurrency
27.07.2022 04:25|ieconomy - Haber Merkezi
Yazar: James Gordon
Yayınlanma: 27 Temmuz 2022 04:25
Güncellenme: 13 Temmuz 2026 15:10
What is a Double Top Pattern?
What does the double top pattern, which is one of the easy to analyze technical patterns frequently preferred by traders in cryptocurrency markets, mean? What is a double top pattern target?
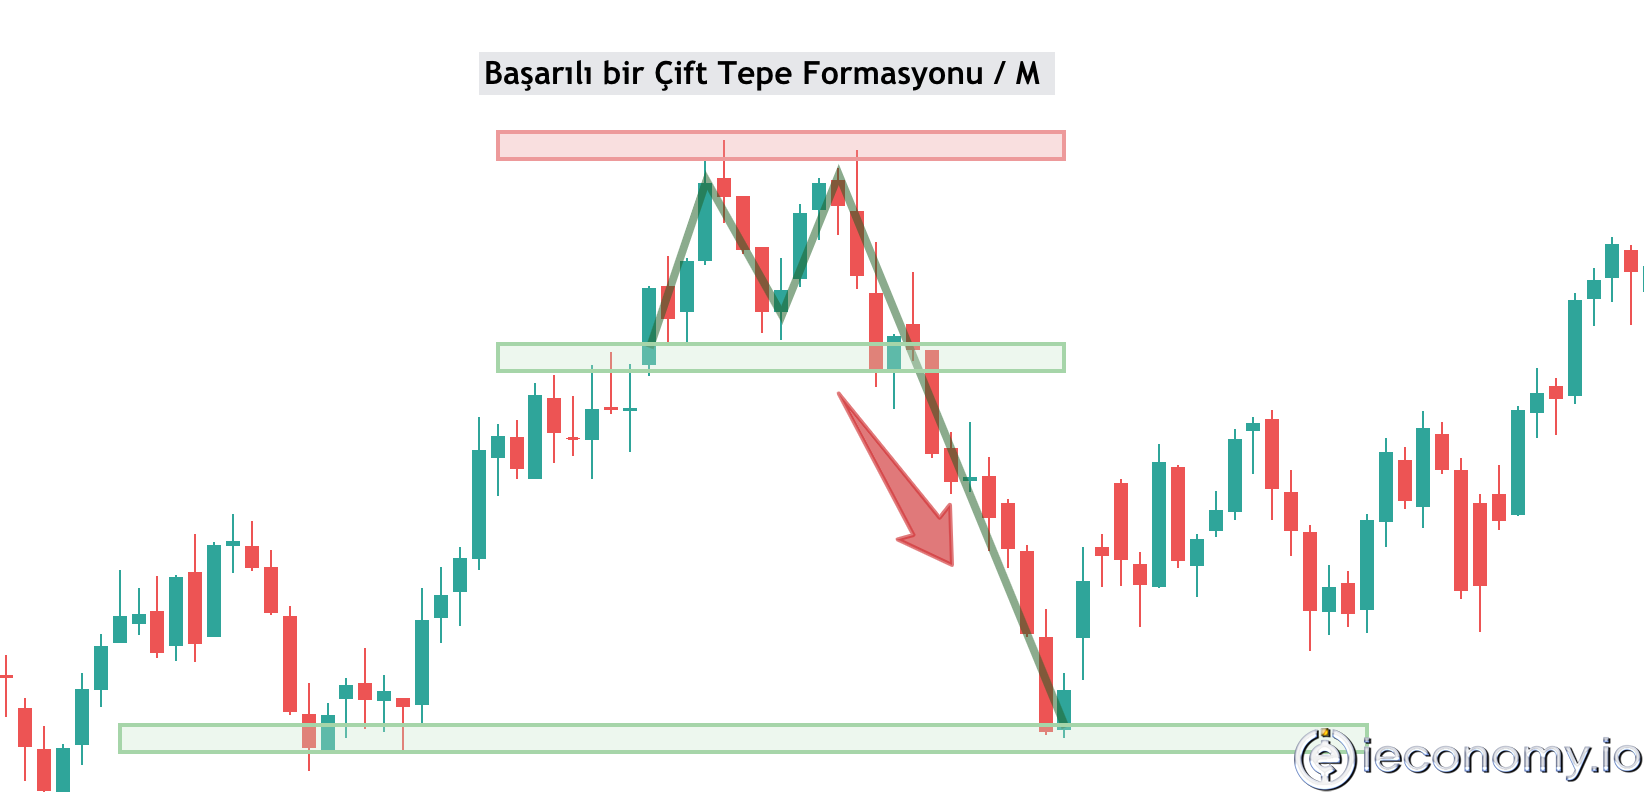
This pattern, which is defined as a curious double top or double top pattern in cryptocurrency markets, is assumed by technical analysts to be a harbinger of the end of a strong uptrend. This pattern, which is often used to predict the bearish direction at the end of bullish trends, is also preferred in bearish positions for experienced traders. While the two peaks that form are almost equal to each other, a valley-like gap is observed between the two peaks. At the end of the bull season, success can be achieved with double top patterns. A double top is formed with a reaction rally after a decline. A reaction rally after the first decline from the peak forms the second top. It stops very close to or at the same level as the second low.What happens after a double top pattern?
After a double top pattern, the bull's end is announced. Periodically, a double top pattern may also form in bearish scenarios. Double tops at the end of the bullish season have high size and price ranges. During bearish periods, it can record rare earnings tops. After seeing the double top, there is a possibility of waiting for a decline until the neck area. As well as the peaks that form become resistance points. If the trend line is drawn, the resistance point is easily observed from the peaks. Likewise, if the neck works as a support, the path towards the W pattern opens.
What is a chart double top pattern?
It is a price chart pattern that appears on the price chart when the uptrend ends and a downtrend begins. At some point when the price continues to fall rapidly, traders make their first purchases in the belief that the uptrend will begin. This creates the first bottom reversal and the price turns upwards. The price goes up for a while, encouraging sellers who believe that the decline will continue, and the price turns down again. It is important to get confirmation from the chart to know whether it is a double top or a W pattern. Risk-loving traders can use stops to enter the position at the bottom and wink at the W pattern. In the absence of an uptrend, the neckline is broken and new lows are recorded.What does a double top pattern mean in the stock market?
It is defined as a reliable reversal pattern that can be used to enter a bearish position after a bullish trend. The story of this pattern is quite simple, which is why it is favored by many traders in the stock market. While the peak seen somewhere in the uptrend does not make sense to anyone at the beginning, it starts to give the first signals of problems when the subsequent volume-free relaxation creates a bottom and then starts to rise again. The reason is that despite the rise, the volume cannot catch up with the volume that formed the previous top. This is perceived as a weakening sign that something is wrong. The first thing an analyst who realizes this should do is to draw a horizontal resistance starting from the first peak, thinking that prices approaching the previous lows and peaks may have problems and that these places can work as support and resistance. The investment information, comments and recommendations in this article do not constitute investment advice. Investment advisory services are provided individually, taking into account the risk and return preferences of individuals. The content contained herein is in no way directive and the recommendations are general in nature. These recommendations may not be suitable for your financial situation and risk and return preferences. Therefore, making an investment decision based solely on the information contained herein may not produce results in accordance with your expectations.You May Also Be Interested In:
What is the W Formation, What does it mean, How does it work? The W pattern is an analysis pattern that identifies downtrends. A pattern is a form of formation and upbringing. It can be thought of as strengthening the education received on any subject. The W pattern shows the return of a bearish price to a bottom resistance point by peaking with the correction movement that develops after seeing the bottom level. What is the W pattern, what does it mean? How it works, what happens afterwards, we have compiled it with all the details. https://ieconomy.io/en/what-is-the-w-formation-what-does-it-mean-how-does-it-work/İLGİLİ HABERLER
European stocks soared and focus shifted to German retail sales after Powell's speech!
Forex Signal For TRY/USD: Inflation Slowdown in November.
Forex Signal For GBP/USD: Bullish Trend Still Not Breaking While Recovery Continues.
Forex Signal For EUR/USD: Starry US Data Points to Higher Fed Increases.
Forex Signal For BTC/USD: Downside Continues as Bitcoin Recovery Moves Less.
En Popüler Haberler
Yorum Yap
Yorumlar
Henüz yorum yapan yok! İlk yorumu siz yapın...